
Descrição
Explicação da Estratégia de Seguimento de Tendência Forex (Inglês)
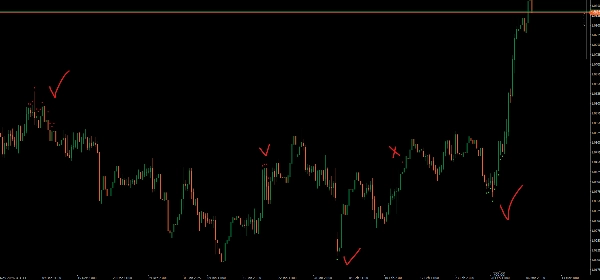
Esta estratégia de seguimento de tendência foi projetada para identificar tendências fortes do mercado usando Médias Móveis Exponenciais (EMAs), MACD e ADX. Ela gera sinais de compra e venda baseados no momentum e na força da tendência.
Como Funciona
1️⃣ Identificando a Direção da Tendência
- EMA Rápida (21) e EMA Lenta (50) determinam a direção geral da tendência:
-
- Tendência de Alta → EMA Rápida está acima da EMA Lenta
- Tendência de Baixa → EMA Rápida está abaixo da EMA Lenta
2️⃣ Medindo o Momentum da Tendência (Histograma MACD)
- O histograma MACD confirma o momentum:
-
- Momentum de Alta → Histograma MACD está acima de zero
- Momentum de Baixa → Histograma MACD está abaixo de zero
3️⃣ Verificando a Força da Tendência (Indicador ADX)
- O ADX (14) mede a força da tendência:
-
- Tendência Forte → ADX está acima de 25
- Tendência Fraca → ADX está abaixo de 25 (sem sinais)
Execução da Operação
✅ Sinal de Compra (Entrada de Alta)
- EMA Rápida > EMA Lenta (Tendência de alta)
- Histograma MACD > 0 (Confirmação de momentum)
- ADX > 25 (Tendência forte)
- 🔹 Seta de compra aparece abaixo do preço mínimo
❌ Sinal de Venda (Entrada de Baixa)
- EMA Rápida < EMA Lenta (Tendência de baixa)
- Histograma MACD < 0 (Confirmação de momentum)
- ADX > 25 (Tendência forte)
- 🔻 Seta de venda aparece acima do preço máximo
Principais Características
✔ Evita tendências fracas usando ADX
✔ Filtra sinais falsos com confirmação do MACD
✔ Parâmetros ajustáveis para melhor personalização
Este indicador ajuda os traders a seguir tendências fortes enquanto evita condições fracas do mercado. 🚀


