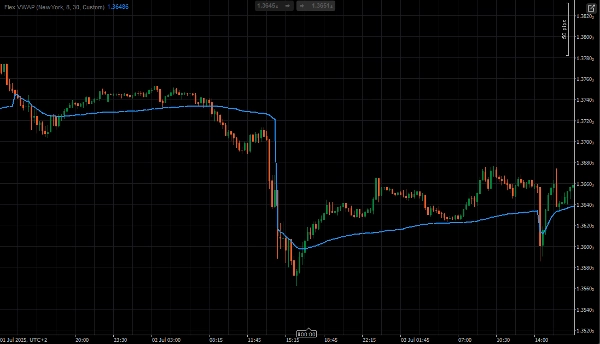
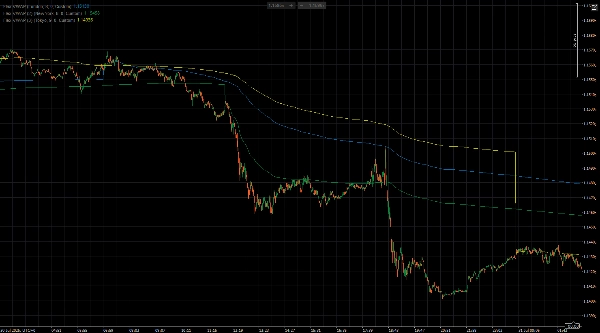
Nhà môi giới & tự doanh
Dành cho doanh nghiệp
00
Days
:
00
Hours
:
00
Minutes
:
00
Seconds
Flex VWAP
Logo "Flex VWAP"
Kể từ 15/06/2025
Cài đặt miễn phí
387
Ảnh "Flex VWAP" được tải lênẢnh "Flex VWAP" được tải lên

The Flex VWAP indicator provides a volume-weighted average price calculation with highly customizable reset periods including yearly, monthly, weekly, daily, hourly intervals, and custom time settings. It supports multiple timezone configurations (New York, London, Tokyo, Sydney, Local) allowing traders to align VWAP calculations with specific trading sessions. Users can set custom reset times down to the minute for precise session management and personalized trading strategies. The VWAP line updates in real-time using typical price methodology and provides a reliable reference for institutional trading levels and market bias analysis.

Forex Session Settings
==================

London Session
Base TimeZone: London
Custom Hour: 8
Custom Minute: 0
Reset Period: Custom

New York Session
Base TimeZone: NewYork
Custom Hour: 8
Custom Minute: 0
Reset Period: Custom

Tokyo Session
Base TimeZone: Tokyo
Custom Hour: 9
Custom Minute: 0
Reset Period: Custom


Stock Exchange Session Settings
==========================

London Session
Base TimeZone: London
Custom Hour: 8
Custom Minute: 0
Reset Period: Custom

New York Session
Base TimeZone: NewYork
Custom Hour: 9
Custom Minute: 30
Reset Period: Custom

Tokyo Session
Base TimeZone: Tokyo
Custom Hour: 9
Custom Minute: 0
Reset Period: Custom

5.0
Đánh giá: 1
5
100 %
4
0 %
3
0 %
2
0 %
1
0 %
Đánh giá của khách hàng
July 14, 2025
Same as description, good parameters
Sản phẩm khác của tác giả này
Simple MACD Histogram
Simple MACD Histogram with color-coded rising (green) and falling (red) momentum bars.
Bạn cũng có thể thích
Chỉ báo
NAS100
RSI
Indices
+7
QX FrameForge
Multi-timeframe market-state dashboard: Score (-100..+100) + UP/NEUT/DN per TF, with optional closed-candle arrows.
xhobaniFX_ADR-Lines
xhobaniFX_ADR-Lines: Average Daily Range Horizontal Lines
Chỉ báo
ZigZag
VWAP
FVG
+4
Candle Volume Profile Demo
Candle Volume Profile for Crypto
MTF Candle Countdown
Stay ahead with a real-time countdown to candle closes on all key timeframes: 5m, 15m, 30m, 1H, 4H, and Daily.
Chỉ báo
Indices
Stocks
Commodities
+2
Market Sessions - Free
Track major trading sessions (Tokyo, London, New York) with customizable colors and visual sessions on your chart.
Chỉ báo
NAS100
NZDUSD
XAUUSD
+13
Side Volume Profile
Right-anchored cTrader Volume Profile with VAH/VAL/POC, LVZ, top volume+EMA, themes, and fast, readable visuals.
Chỉ báo
NAS100
NZDUSD
Breakout
+13
ORDERFLOW_SKIA_Plynuly
This Indicator will show you Direction, Distance, and Time;
Chỉ báo
Indices
Forex
EURUSD
+2
US Dollar Index
US Dollar Index
Chỉ báo
RSI
XAUUSD
Breakout
+6
Market Imbalance
Identifies market imbalances and visually marks key areas based on price patterns and volatility (ATR).
Chỉ báo
NAS100
NZDUSD
XAUUSD
+12
Coral Filter Lite
🐠 Free trend baseline - without the noise. Free limited version of Coral Filter X Pro 🐠
Candlestick Patterns - Special Candles
Boost your trading with Candlestick Patterns for cTrader – auto-detect key signals for smarter, faster decisions!
Chỉ báo
NAS100
NZDUSD
Martingale
+26
vWAP plus
An advanced VWAP with multi-VWAP (Daily/Weekly/Monthly/Anchored), click-to-anchor, configurable alerts, a stats panel,
Chỉ báo
NAS100
Indices
XAUUSD
+4
PrevDayProjection
Automatically calculates the previous day’s high and low, determines the range, and then projects Fibonacci levels.
Chỉ báo
NAS100
XAUUSD
FVG
+10
FVG with HTF Confluence
This is a specialized indicator that focuses exclusively on identifying Fair Value Gaps (FVGs) that are aligned with HTF
Chỉ báo
Indices
Forex
USDJPY
Yen Index w HMA
Yen Index
Chỉ báo
ATR
Fibonacci
Scalping
+1
Auto Fibonacci With Golden Levels
Auto Fibonacci Retracement Pro – Smart Swing & Golden Zone Levels
Chỉ báo
NAS100
NZDUSD
Breakout
+18
Volume Profile Pivot Box Range
Most advanced Volume Profile Pivot Box indicator — auto pivots, volume zones, smart candle coloring & SMC trading tool.
BarSentiments
This Indicator is a technical analysis tool that measures the strength and direction of market sentiment