
Simple MACD Histogram
Chỉ báo
255 lượt tải
Phiên bản 1.0, Aug 2025
Windows, Mac
Mô tả
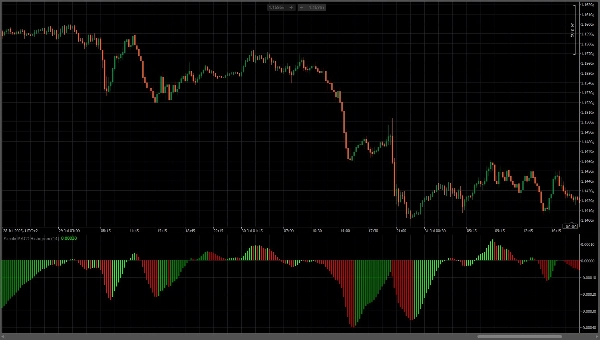
Chỉ báo MACD Histogram tùy chỉnh này hiển thị biểu đồ MACD với kiểu dáng rõ ràng hơn về mặt hình ảnh. Chỉ báo sử dụng chu kỳ EMA nhanh là 14, tự động tính EMA chậm là nhanh cộng 2 (16). Chỉ báo có mã màu tương phản cao để nhận biết xu hướng ngay lập tức: các thanh màu xanh lá sáng biểu thị động lượng tăng (tăng giá), trong khi các thanh màu đỏ biểu thị động lượng giảm (giảm giá). Các thanh biểu đồ mở rộng đối xứng từ đường trung tâm bằng không, tạo ra một biểu diễn trực quan trực quan trong đó màu xanh lá báo hiệu áp lực mua và màu đỏ báo hiệu áp lực bán. Phong cách trực quan này cung cấp các tín hiệu động lượng rõ ràng, không mơ hồ và giúp xác định các khả năng đảo chiều xu hướng và thay đổi động lượng trong hành động giá.
Tóm tắt
Tóm tắt AI
The Simple MACD Histogram is a custom technical indicator designed to visually represent momentum in price action. It calculates a fast EMA with a period of 14 and a slow EMA set automatically to 16 (fast EMA plus 2). The histogram bars extend symmetrically from a zero line, with bright green bars indicating rising (bullish) momentum and red bars indicating falling (bearish) momentum. This color-coded display enhances clarity for quick trend recognition, helping users identify potential trend reversals and shifts in momentum. The indicator is intended for use in trading analysis to provide clear, unambiguous signals of buy and sell pressure.
Hồ sơ chỉ báo
Đánh giá của khách hàng
0.0
Đánh giá: 0
Đánh giá của khách hàng
Sản phẩm này chưa có đánh giá nào. Bạn đã dùng thử chưa? Hãy là người đầu tiên chia sẻ với mọi người!
Thảo luận
Câu hỏi thường gặp
Các sản phẩm có sẵn trên cTrader Store, bao gồm bot giao dịch, chỉ báo và plugin, được cung cấp bởi các nhà phát triển bên thứ ba và chỉ nhằm mục đích cung cấp thông tin và tiếp cận kỹ thuật. cTrader Store không phải là nhà môi giới và không cung cấp lời khuyên đầu tư, khuyến nghị cá nhân hay bất kỳ đảm bảo nào về hiệu suất trong tương lai.


Giá
Kể từ 15/06/2025
672
Cài đặt miễn phí