Mô tả
Chỉ báo này có thể được sử dụng trên bất kỳ cặp Forex nào!
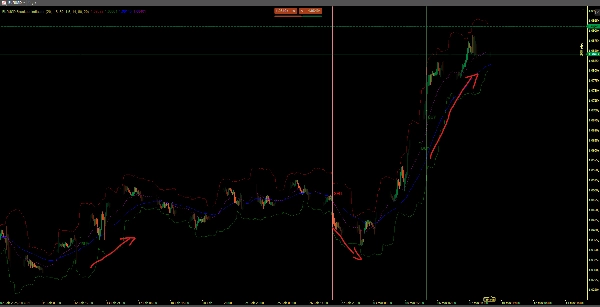
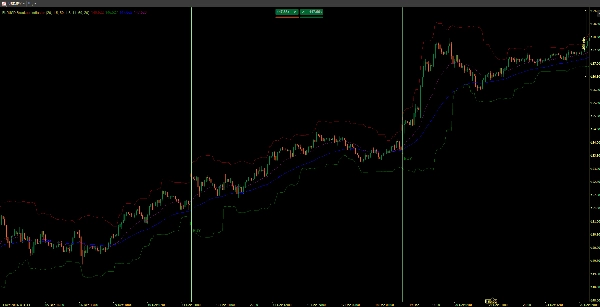
Chỉ báo EURUSD Breakout là một công cụ phân tích kỹ thuật toàn diện được thiết kế cho biểu đồ 15M, 30M, 1H, 2H ... giúp xác định các cơ hội giao dịch breakout có xác suất cao bằng cách sử dụng nhiều phương pháp xác nhận.
Chỉ báo này tạo ra các tín hiệu mua và bán dựa trên giá phá vỡ các mức hỗ trợ và kháng cự đã tính toán, đồng thời yêu cầu xác nhận từ:
- Xu hướng khung thời gian hiện tại (sử dụng EMA 50 kỳ)
- Sự phù hợp xu hướng khung thời gian cao hơn (sử dụng EMA 20 kỳ trên biểu đồ 1 giờ)
- Khối lượng trên mức trung bình (1,5 lần khối lượng bình thường)
- Mức breakout điều chỉnh theo biến động (sử dụng ATR)
Tất cả các tín hiệu được hiển thị rõ ràng trực tiếp trên biểu đồ với các dấu hiệu và nhãn màu sắc. Chỉ báo có thể tùy chỉnh hoàn toàn với bảy tham số để điều chỉnh độ nhạy dựa trên điều kiện thị trường và sở thích giao dịch.
Bằng cách yêu cầu sự phù hợp giữa nhiều khung thời gian và các yếu tố xác nhận, chỉ báo này tạo ra ít tín hiệu hơn nhưng chất lượng cao hơn, giúp lọc bỏ các breakout giả và xác định các cơ hội giao dịch mạnh hơn trong cặp EURUSD.
Tóm tắt
Đánh giá của khách hàng
5 | 100 % | |
4 | 0 % | |
3 | 0 % | |
2 | 0 % | |
1 | 0 % |