present
Đăng ký và nhận ưu đãi $50 cho lần mua đầu tiên
Trading product for Indicators Volume Profile 1 Chỉ báo Signal Indices, image 1
Indicators Volume Profile 1
Chỉ báo
Phiên bản 1.0, Sep 2025
Windows, Mac
4.3
Đánh giá: 3
Trading product for Indicators Volume Profile 1 Chỉ báo Signal Indices, image 2
Trading product for Indicators Volume Profile 1 Chỉ báo Signal Indices, image 3
32.38M
Khối lượng đã giao dịch
154.15K
Pip đạt được
1
Lượt bán

Mô tả

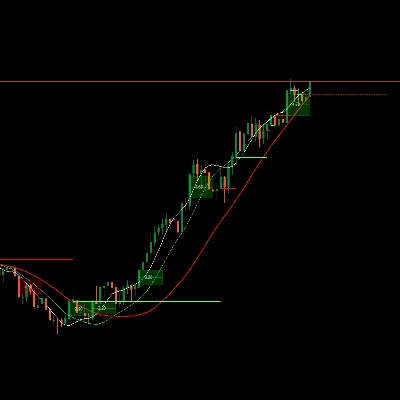
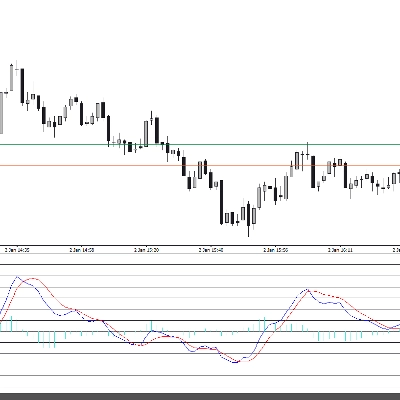
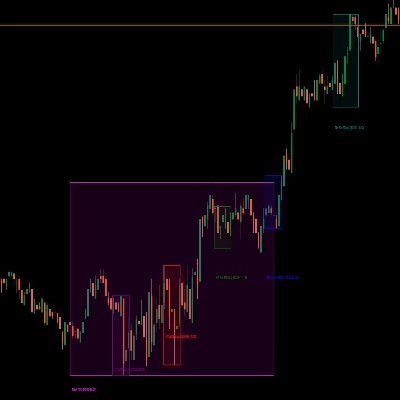
Taiz Pro Volume Profile: Công cụ phân tích cuối cùng để khám phá ý định thị trường


Bạn có mệt mỏi vì phải dựa vào các chỉ báo trễ không cung cấp cho bạn bức tranh toàn cảnh? Chỉ báo Taiz Pro Volume Profile không chỉ là một công cụ khác, mà là cửa sổ của bạn để nhìn thấy những gì đang xảy ra "phía sau hậu trường" trên thị trường.


Khác với các chỉ báo khối lượng truyền thống chỉ hiển thị "khi nào" giao dịch diễn ra, chỉ báo này tiết lộ "ở đâu" giao dịch diễn ra, mang lại cho bạn lợi thế cạnh tranh thực sự.


---

·        Chỉ báo này mang lại gì cho bạn?

o       📈 Xác định các vùng thanh khoản cao: Khám phá các mức giá tập trung khối lượng giao dịch lớn nhất. Đây là những khu vực được các nhà tạo lập thị trường và các tổ chức lớn bảo vệ.

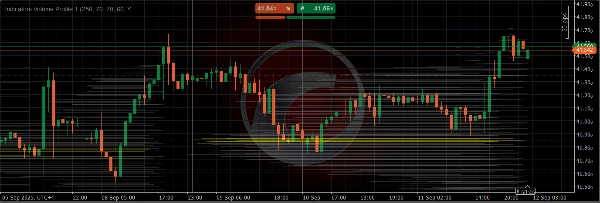
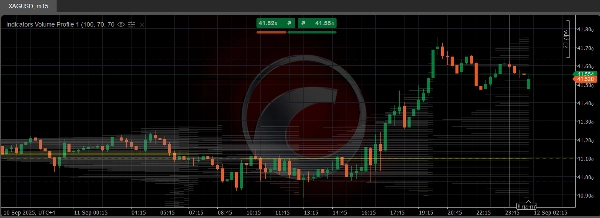
o       🎯 Điểm kiểm soát (Point of Control - POC):* Chỉ báo hiển thị rõ ràng (bằng đường màu vàng) mức giá tại đó khối lượng giao dịch lớn nhất xảy ra. Mức này hoạt động như một nam châm cho giá và là vùng hỗ trợ hoặc kháng cự cực kỳ quan trọng.

o       📊 Vùng giá trị (Value Area - VA): Xác định phạm vi giá (màu xám) nơi 70% giao dịch diễn ra. Giao dịch trên vùng này là tín hiệu tăng mạnh, giao dịch dưới vùng này là tín hiệu giảm.

o       💡 Quyết định giao dịch thông minh hơn: Sử dụng các vùng này để xác định điểm vào lệnh chính xác, đặt lệnh dừng lỗ ở vị trí an toàn và xác định mục tiêu lợi nhuận thực tế.


---


·        Tại sao chỉ báo này tốt hơn?

o       Độ chính xác tính toán vượt trội: Sử dụng thuật toán tiên tiến để phân bổ khối lượng chính xác cho từng biến động giá, mang lại kết quả thực tế hơn.

o       Dễ sử dụng: Giao diện đơn giản và cài đặt rõ ràng cho phép bạn tùy chỉnh chỉ báo phù hợp với phong cách phân tích của mình.

o       Hiệu suất ổn định: Mã được xây dựng nhẹ và ổn định, đảm bảo không làm chậm nền tảng cTrader của bạn.


Nâng tầm phân tích kỹ thuật của bạn. Bắt đầu giao dịch dựa trên dữ liệu thực tế, không chỉ là phỏng đoán. Tải chỉ báo ngay bây giờ.

Tóm tắt

AI summary
Taiz Pro Volume Profile is a professional volume analysis indicator designed to identify true support and resistance zones by revealing where trading volume is concentrated. Unlike traditional volume indicators that show when trades occurred, this tool highlights the specific price levels with the highest liquidity, offering insights into market intentions.

Key features include:
- High liquidity zones: Identifies price levels with the largest traded volumes, often defended by market makers and institutions.
- Point of Control (POC): Marks the price level with the highest volume using a yellow line, serving as a critical support or resistance area.
- Value Area (VA): Displays the price range where 70% of trading volume occurred, shaded in gray; trading above this area suggests bullish momentum, while below indicates bearish signals.
- Precision trading decisions: Helps users pinpoint entry points, set stop-loss orders safely, and establish realistic profit targets.

The indicator employs an advanced algorithm for accurate volume distribution across price movements, ensuring realistic results. It features a user-friendly interface with customizable settings and is optimized for stable, lightweight performance on the cTrader platform.

Applicable markets include Forex, indices, commodities, stocks, and cryptocurrencies, supporting symbols like EURUSD, GBPUSD, XAUUSD, BTCUSD, NAS100, and others. This tool aids traders in making data-driven decisions based on volume profile analysis.
Hồ sơ chỉ báo

Đánh giá của khách hàng

4.3
Đánh giá: 3
5
33 %
4
67 %
3
0 %
2
0 %
1
0 %
Đánh giá của khách hàng
September 25, 2025
The idea is fine, just do not expect it to print perfect entries. It should not replace the chart.
September 23, 2025
The nice part is market notes are quicker to compare. The market context still matters.
September 13, 2025
the strongest use case is the plan becomes easier to stick with. Settings still need care.

Thảo luận

Câu hỏi thường gặp

Signal
Indices
Commodities
GBPUSD
RSI
Bollinger
Scalping
AI
XAUUSD
NAS100
MACD
BTCUSD
Forex
Breakout
EURUSD
NZDUSD
Martingale
Prop
Supertrend
Crypto
Grid
Stocks
ATR
USDJPY
VWAP
Các sản phẩm có sẵn trên cTrader Store, bao gồm bot giao dịch, chỉ báo và plugin, được cung cấp bởi các nhà phát triển bên thứ ba và chỉ nhằm mục đích cung cấp thông tin và tiếp cận kỹ thuật. cTrader Store không phải là nhà môi giới và không cung cấp lời khuyên đầu tư, khuyến nghị cá nhân hay bất kỳ đảm bảo nào về hiệu suất trong tương lai.

Sản phẩm khác của tác giả này

Chỉ báo
Indices
Custom ADX Indicator for precise trend analysis. المؤشر المخصص ADX لتحليل الاتجاه بدقة

Bạn cũng có thể thích

Chỉ báo
Shows BUY & SELL signals for 3 & 4 BAR PATTERN (Morning star/ Evening star). It is adjustable and it will SHOW ARROWS.
Chỉ báo
ATR
RSI
+1
Super Trend Rsi ,ATR + trend change distance + dynamic Alpha, divergence/convergence
Chỉ báo
ATR
Wedge
+2
Strong Supertrend Turn Market Movement into a Clear Map Market analysis
Chỉ báo
MACD
Forex
+6
Auto Signal BUY SELL is a professional decision-making tool designed to help you follow the trend and capture high-proba
Logo "CVD"
Phổ biến
4.6
(3)
$20
/
$30
Chỉ báo
Signal
Cumulative Volume Delta tracks the net difference in tick volume between buying and selling pressure over time
Chỉ báo
ADX
ATR
+5
10 Factors. One Signal. Zero Guesswork.
Chỉ báo
RSI
MACD
+2
A straightforward yet effective tool signals entry points for both buying and selling. Include 3 Moving Average
Chỉ báo
Drawdown Monitor
Protect your funded account. Real-time Daily Equity Drawdown monitor with Green / Orange / Red flashing alerts.
Chỉ báo
Doji
Volume
+5
Instantly spot high-liquidity institutional moves with clean, non-obtrusive triangle alerts on cTrader charts.
Chỉ báo
Prop
Forex
+4
The Smooth Heiken Ashi indicator is a refined charting tool designed to filter out market noise and highlight true price
Chỉ báo
RSI
RSI on the main chart with 45/55 momentum levels, overbought/oversold levels, averaged RSI, and multi-timeframe support.
Logo "macdZR"
Hàng đầu
4.6
(5)
$19
Chỉ báo
MACD
Forex
+5
MACD ZERO LAG. Get faster signals, earlier trend detection, and eliminate the delay of traditional moving averages
Chỉ báo
ATR
RSI
+5
Delta RSI Candle Pro, the indicator that transforms ordinary candlesticks into powerful momentum visualizers.
Chỉ báo
SMC
Prop
+8
KILLZONES AND MACRO SESSIONS
Chỉ báo
Prop
Forex
+11
🌊 See when the market is truly in play. Tsunami measures Relative Volume by time-of-day 🌊
Chỉ báo
Forex
Version 3: Full control of session display including start and end times of all 3 sessions!
Chỉ báo
RSI
SMC
+17
RSI, MACD, Stochastic, CCI & Momentum divergence scanner with confluence scoring. Never miss a signal again!
Chỉ báo
Indices
Multi-Timeframe ADX Trend Dots & Arrows

Giá

32.38M
Khối lượng đã giao dịch
154.15K
Pip đạt được
1
Lượt bán