Candle Pro
مؤشر
121 التنزيلات
الإصدار 1.0، Oct 2025
Windows, Mac
5.0
التقييمات: 1
الوصف
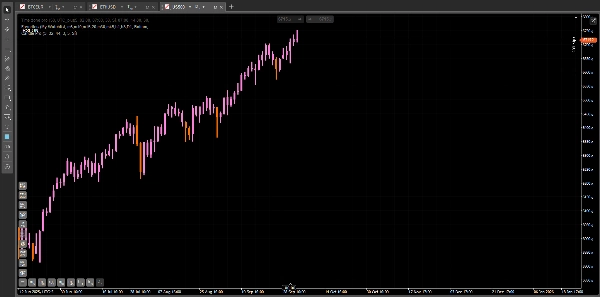
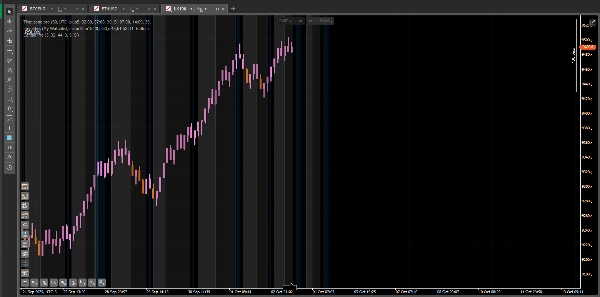
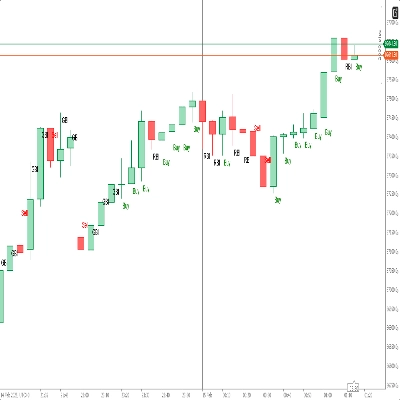
Candle Pro – إشارات RSI المرئية على الشموع
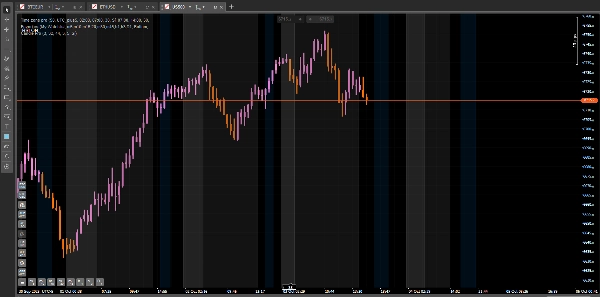
Candle Pro هو مؤشر يبرز الشموع مباشرة على الرسم البياني عندما يصل RSI إلى مستويات الشراء المفرط أو البيع المفرط، مما يحافظ على تركيزك على حركة السعر ويتجنب الرسوم البيانية الفرعية الإضافية.
🧭 كيفية الاستخدام
- أضف المؤشر إلى الرسم البياني الخاص بك.
- قم بضبط معلمات RSI لتناسب أسلوب تداولك.
- راقب كيف تتغير ألوان الشموع عند المستويات القصوى، مما يشير إلى مناطق انعكاس محتملة أو زخم.
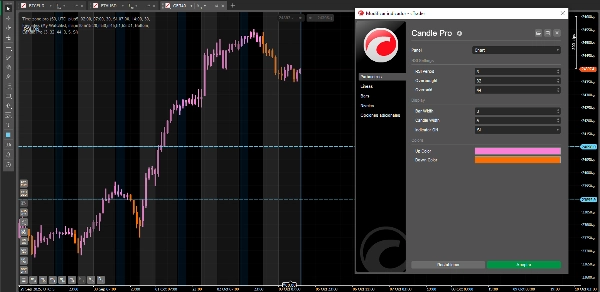
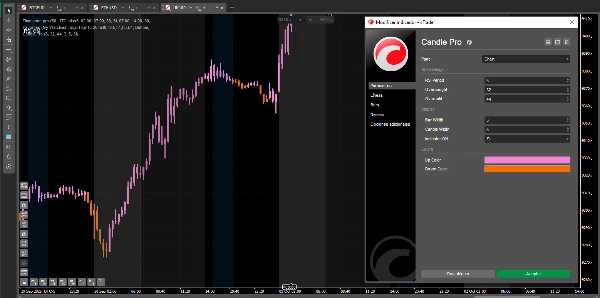
⚙️ الإعدادات المقترحة
للحصول على استجابة سريعة ودقيقة:
- فترة RSI: 3
- الشراء المفرط: 32
- البيع المفرط: 44
- عرض الشمعة: 3
- عرض الشريط: 1
✨ الفوائد
- إشارات بصرية نظيفة مباشرة على السعر.
- يعمل مع أي رمز وزمن.
- ألوان وعرض خطوط قابلة للتخصيص بالكامل.
- مثالي لـ التداول السريع، التداول اليومي، والتداول المتأرجح.
ملاحظة: هذه هي الإصدار المجاني من Candle Pro. إصدار مميز قادم قريبًا، مليء بالميزات الحصرية للارتقاء بتداولك إلى المستوى التالي.
الملخص
ملخص الذكاء الاصطناعي
Candle Pro is a trading indicator designed to visually highlight RSI (Relative Strength Index) signals directly on price candles, eliminating the need for separate RSI sub-charts. It marks candles on the chart when RSI reaches overbought or oversold levels, helping traders identify potential reversal or momentum zones. Users can customize RSI parameters, candle colors, and line widths to suit their trading style. The indicator supports any symbol and timeframe, making it suitable for scalping, intraday, and swing trading strategies. Suggested settings include an RSI period of 3, overbought level at 32, and oversold level at 44 for fast and precise signals. Candle Pro emphasizes clean visual cues integrated with price action to maintain chart clarity. This version is the free edition, with a premium version planned to offer additional features. Supported markets include Forex, Indices, and Crypto.
ملف تعريف المؤشر
تقييمات العملاء
5.0
التقييمات: 1
5 | 100 % | |
4 | 0 % | |
3 | 0 % | |
2 | 0 % | |
1 | 0 % |
تقييمات العملاء
November 3, 2025
This is an interesting indicator it really helps to filter out market noise. Thanks
مناقشة
الأسئلة الشائعة
Forex
Indices
RSI
Crypto
يتم توفير المنتجات المتاحة من خلال cTrader Store، بما في ذلك روبوتات التداول والمؤشرات والإضافات، من قبل مطوري الطرف الثالث وإتاحتها لأغراض الوصول المعلوماتي والفني فقط. cTrader Store ليس وسيطًا ولا يقدم نصائح استثمارية أو توصيات شخصية أو أي ضمان للأداء المستقبلي.


السعر
منذ 24/02/2025
15
المبيعات
1.85K
التثبيتات المجانية