
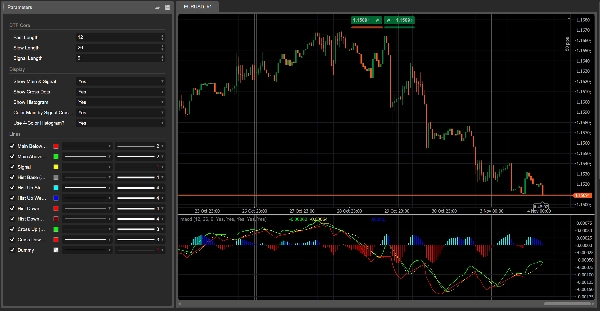
Dynamic Trend Flux
Chỉ báo
Phiên bản 1.0, Nov 2025
Windows, Mac
4.0
Đánh giá: 1
Mô tả
Dòng Xu Hướng Động
Loại: Bộ dao động động lượng / xu hướng (kiểu MACD, đa màu)
Nó làm gì
Dòng Xu Hướng Động là một bộ dao động động lượng có màu dựa trên sự khác biệt EMA nhanh/chậm cổ điển cộng với một đường tín hiệu.
Nó giúp bạn nhìn nhanh:
- khi động lượng là tăng hay giảm,
- động lượng có đang tăng cường hay suy yếu,
- và nơi xu hướng thay đổi xảy ra (giao cắt giữa đường chính và đường tín hiệu).
Chỉ báo vẽ:
- Đường chính (đường Flux)
-
- được xây dựng từ sự khác biệt giữa EMA nhanh và chậm
- thay đổi màu sắc tùy thuộc vào việc nó ở trên hay dưới đường tín hiệu (tùy chọn).
- Đường tín hiệu
-
- là trung bình động của đường chính, được dùng như một cú kích hoạt mượt mà hơn.
- Biểu đồ cột với 4 màu (tùy chọn)
-
- hiển thị khoảng cách giữa đường chính và đường tín hiệu,
- màu sắc mã hóa cả hướng đi (trên/dưới không) và thay đổi sức mạnh từ thanh này sang thanh khác.
- Chấm trên các điểm giao cắt (tùy chọn)
-
- nổi bật nơi đường chính giao cắt đường tín hiệu → khả năng thay đổi pha xu hướng.
Tất cả các phép tính được thực hiện trên khung thời gian biểu đồ hiện tại.
Cách đọc nó
1. Đường số 0
- Giá trị trên số 0 → áp lực tăng chiếm ưu thế.
- Giá trị dưới số 0 → áp lực giảm chiếm ưu thế.
2. Biểu đồ cột có màu
Khi chế độ 4 màu BẬT:
- Màu nước biển nhạt → trên số 0 và đang tăng
-
- động lượng tăng mạnh / đang tăng.
- Màu xanh dương → trên số 0 nhưng đang giảm
-
- xu hướng tăng vẫn còn, nhưng động lượng đang hạ nhiệt.
- Màu đỏ → dưới số 0 và đang giảm
-
- động lượng giảm mạnh / đang tăng.
- Màu nâu đỏ → dưới số 0 nhưng đang tăng
-
- pha giảm vẫn còn, nhưng động lượng đang mất sức.
Điều này giúp dễ dàng phát hiện phân kỳ và thay đổi động lượng bằng mắt thường hơn nhiều.
3. Đường chính & Đường tín hiệu
- Đường chính ở trên Đường tín hiệu → pha tăng.
- Đường chính ở dưới Đường tín hiệu → pha giảm.
Nếu bật thay đổi màu:
- Đường chính Màu xanh chanh = trên Đường tín hiệu (kiểm soát tăng)
- Đường chính Màu đỏ = dưới Đường tín hiệu (kiểm soát giảm)
4. Chấm giao cắt
- Chấm xanh lá (Giao cắt lên) → đường chính cắt lên trên đường tín hiệu
-
- có thể là khởi đầu của một đợt tăng giá.
- Chấm đỏ (Giao cắt xuống) → đường chính cắt xuống dưới đường tín hiệu
-
- có thể là khởi đầu của một đợt giảm giá.
Luôn kết hợp các tín hiệu này với cấu trúc / hành động giá và bối cảnh khung thời gian cao hơn.
Các tham số (Tiếng Anh)
DTF Core
- Độ dài nhanh – chu kỳ của EMA nhanh (mặc định 12).
- Độ dài chậm – chu kỳ của EMA chậm (mặc định 26).
- Độ dài tín hiệu – chu kỳ của SMA tín hiệu áp dụng cho đường chính (mặc định 9).
Hiển thị
- Hiển thị Đường chính & Tín hiệu – bật/tắt hai đường.
- Hiển thị Chấm giao cắt – hiển thị chấm trên các điểm giao cắt chính/tín hiệu.
- Hiển thị Biểu đồ cột – bật/tắt biểu đồ cột phía sau.
- Tô màu Đường chính theo Giao cắt Tín hiệu?
-
- BẬT → đường chính Màu xanh chanh trên tín hiệu, Màu đỏ dưới.
- TẮT → đường chính giữ màu Màu đỏ.
- Sử dụng Biểu đồ cột 4 màu?
-
- BẬT → logic màu nước biển nhạt / xanh dương / đỏ / nâu đỏ.
- TẮT → biểu đồ cột chỉ có một màu xám.
Tóm tắt
Hồ sơ chỉ báo
Đánh giá của khách hàng
4.0
Đánh giá: 1
5 | 0 % | |
4 | 100 % | |
3 | 0 % | |
2 | 0 % | |
1 | 0 % |
Thảo luận
Câu hỏi thường gặp
Signal
Indices
Commodities
GBPUSD
RSI
Bollinger
Fibonacci
Scalping
AI
XAUUSD
NAS100
MACD
BTCUSD
Forex
Breakout
EURUSD
NZDUSD
Martingale
Prop
ZigZag
Supertrend
Fair Value Gap
SMC
Crypto
Grid
Stocks
ATR
USDJPY
VWAP
Các sản phẩm có sẵn trên cTrader Store, bao gồm bot giao dịch, chỉ báo và plugin, được cung cấp bởi các nhà phát triển bên thứ ba và chỉ nhằm mục đích cung cấp thông tin và tiếp cận kỹ thuật. cTrader Store không phải là nhà môi giới và không cung cấp lời khuyên đầu tư, khuyến nghị cá nhân hay bất kỳ đảm bảo nào về hiệu suất trong tương lai.


![Logo "[CB] Pivot Points Pro"](https://cdn.ctrader.com/image/webp/43463c82-67b0-4f10-a4ba-901bba091d81_32594)


Giá
42.11M
Khối lượng đã giao dịch
6.13M
Pip đạt được
221
Lượt bán
8.38K
Cài đặt miễn phí