
KeyLevels
Chỉ báo
328 lượt tải
Phiên bản 1.0, Nov 2025
Windows, Mac
Mô tả
Tổng quan
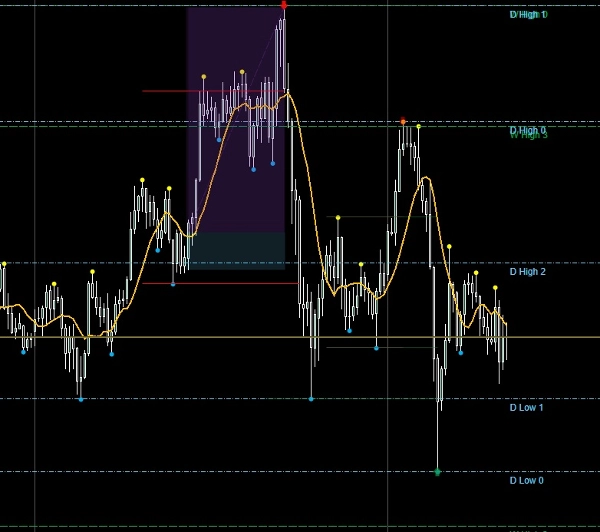
Chỉ báo Các Mức Chính được xây dựng dành cho các nhà giao dịch dựa vào các mốc thời gian cao hơn để hướng dẫn thực hiện trong ngày. Nó tự động xác định và vẽ các đường ngang cho các mức cao và thấp hàng tháng, hàng tuần và hàng ngày, giúp bạn nhận biết cấu trúc ngay lập tức trên nhiều khung thời gian. Mỗi mức đều có thể tùy chỉnh hoàn toàn, vì vậy bạn có thể điều chỉnh hình ảnh cho phù hợp với sách hướng dẫn và quy trình làm việc của mình.
Các tính năng chính
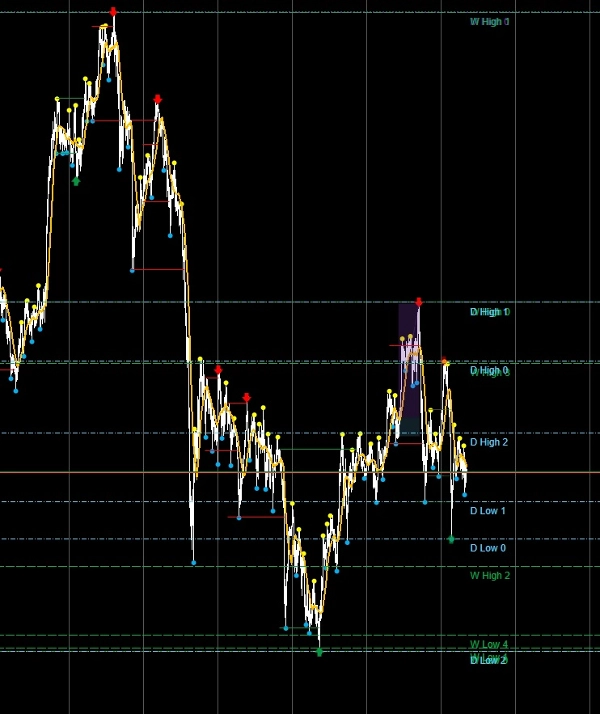
- 🔹 Mức đa khung thời gian – Vẽ các mức cao và thấp từ các thanh hàng tháng, hàng tuần và hàng ngày.
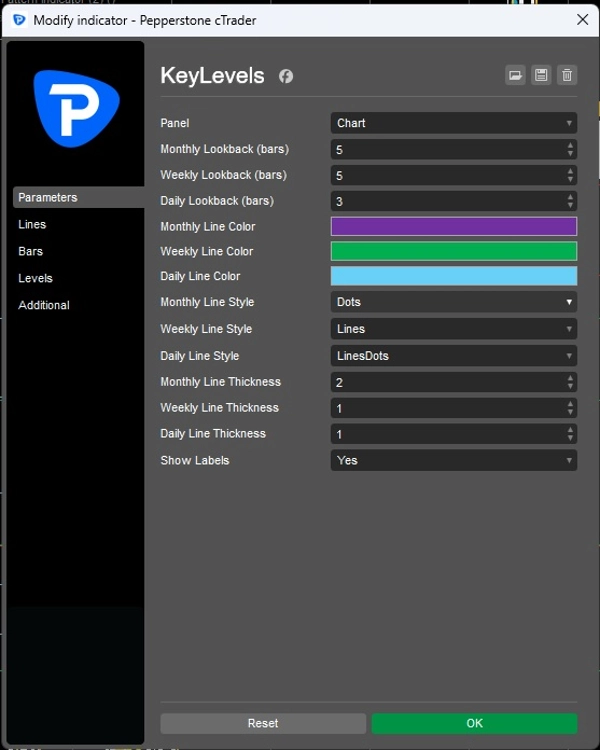
- 🔹 Khoảng thời gian xem lại tùy chỉnh – Chọn số lượng thanh quá khứ để bao gồm cho mỗi khung thời gian.
- 🔹 Tùy chỉnh hình ảnh – Đặt màu sắc, kiểu đường và độ dày riêng biệt cho các mức hàng tháng, hàng tuần và hàng ngày.
- 🔹 Tùy chọn nhãn – Bật/tắt nhãn để nhận diện rõ ràng từng mức.
- 🔹 Cập nhật động – Các mức tự động làm mới khi các thanh mới đóng lại.
- 🔹 Tích hợp biểu đồ sạch – Các đường được vẽ trực tiếp trên biểu đồ của bạn để dễ tham khảo.
Lợi ích cho nhà giao dịch
- Neo các thiết lập trong ngày của bạn vào các mức thời gian cao hơn khách quan.
- Tăng cường kỷ luật và bộ lọc niềm tin bằng cách chỉ hiển thị các điểm cấu trúc chính.
- Tiết kiệm thời gian bằng cách tự động vẽ các mức — không còn phải vẽ thủ công.
- Tăng cường sự rõ ràng khi kết hợp phân tích nhiều khung thời gian.
Các trường hợp sử dụng
- Các nhà giao dịch lướt sóng trong ngày có thể căn chỉnh điểm vào lệnh với các mức hàng ngày hoặc hàng tuần.
- Các nhà giao dịch swing có thể theo dõi các mốc hàng tháng để thiết lập tiếp diễn.
- Các nhà giao dịch theo sách hướng dẫn có thể tích hợp chỉ báo vào danh sách kiểm tra thống nhất của họ để phân loại ngay lập tức.
Tóm tắt
Hồ sơ chỉ báo
Đánh giá của khách hàng
0.0
Đánh giá: 0
Đánh giá của khách hàng
Sản phẩm này chưa có đánh giá nào. Bạn đã dùng thử chưa? Hãy là người đầu tiên chia sẻ với mọi người!
Thảo luận
Câu hỏi thường gặp
BTCUSD
Forex
Signal
Breakout
Indices
EURUSD
Commodities
GBPUSD
NZDUSD
Prop
Scalping
Crypto
Stocks
XAUUSD
NAS100
USDJPY
Các sản phẩm có sẵn trên cTrader Store, bao gồm bot giao dịch, chỉ báo và plugin, được cung cấp bởi các nhà phát triển bên thứ ba và chỉ nhằm mục đích cung cấp thông tin và tiếp cận kỹ thuật. cTrader Store không phải là nhà môi giới và không cung cấp lời khuyên đầu tư, khuyến nghị cá nhân hay bất kỳ đảm bảo nào về hiệu suất trong tương lai.
Sản phẩm khác của tác giả này


Giá
Kể từ 24/04/2025
169.78M
Khối lượng đã giao dịch
17.75K
Pip đạt được
11
Lượt bán
328
Cài đặt miễn phí