
Mô tả
📈 Trung bình động tín hiệu 📉
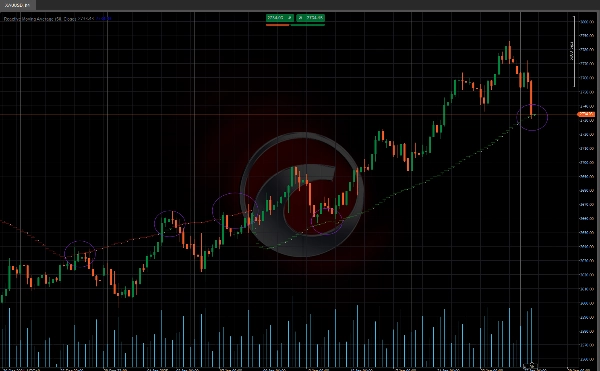
Trung bình động tín hiệu Signal Moving Average là một chỉ báo kết hợp giữa Trung bình động đơn giản (SMA) với phép tính tương quan động để thích ứng tốt hơn với điều kiện thị trường. 🎯 Chỉ báo này điều chỉnh độ nhạy dựa trên sức mạnh của xu hướng, làm cho nó trở thành công cụ mạnh mẽ để xác định xu hướng và lọc bỏ nhiễu thị trường. 🌟
Các tính năng chính 🔑
📊 Trung bình động điều chỉnh:
- Đường trung bình động điều chỉnh động dựa trên tương quan giữa giá và thời gian.
- Trong các thị trường có xu hướng mạnh, trung bình động di chuyển nhanh hơn để theo sát giá. 🚀
- Trong các thị trường đi ngang, trung bình động giữ ổn định hơn, giảm các tín hiệu sai. 🛑
🔢 Phép tính tương quan:
- Chỉ báo tính toán tương quan giữa giá và thời gian sử dụng công thức Pearson.
- Nó điều chỉnh trung bình động dựa trên hệ số xác định (R²). 🧮
👀 Trực quan hóa:
- Hiển thị rõ ràng và trực quan để dễ dàng giải thích. 📉📈
Cách sử dụng chỉ báo 🛠️
🔍 Xác định xu hướng:
- Xu hướng tăng: Khi giá nằm trên trung bình động có tương quan. 🐂
- Xu hướng giảm: Khi giá nằm dưới trung bình động có tương quan. 🐻
✅ Xác nhận tín hiệu:
- Sử dụng trung bình động điều chỉnh như mức hỗ trợ hoặc kháng cự động. 🛡️
- Kết hợp chỉ báo này với các công cụ kỹ thuật khác để xác nhận tín hiệu. 🔄
Điều chỉnh trung bình động ⚙️
Thuật toán điều chỉnh trung bình động dựa trên giá trị của R²:
- Nếu R² > 0.5 (tương quan đáng kể):
-
- Trung bình động được điều chỉnh bằng cách kết hợp có trọng số giữa giá trị SMA hiện tại và giá trị trước đó của trung bình động điều chỉnh (_ma).
- Trọng số phụ thuộc vào giá trị của R². ⚖️
- Nếu R² ≤ 0.5 (tương quan không đáng kể):
-
- Trung bình động được điều chỉnh bằng cách trừ đi một giá trị tỷ lệ với độ chênh tuyệt đối giữa giá trị SMA hiện tại và giá trị trước đó của trung bình động điều chỉnh. 🔄
- Chỉ báo cửa hàng Ctrader:
Phiên chênh lệch giá trị hợp lý
Cấu trúc thị trường động
Phân tích điểm quay
Hồi quy Fibonacci tuyến tính
đa khung thời gian
Chênh lệch giá trị hợp lý động lượng
Định hướng nến đa cấp
Trình theo dõi
Đường hỗ trợ và
kháng cự xu hướng tự động
Tóm tắt
Key functionalities include:
- **Adjusted Moving Average**: The moving average line dynamically adapts according to the correlation between price and time. It accelerates in strong trending markets to closely follow price movements and stabilizes in sideways markets to minimize false signals.
- **Correlation Calculation**: Utilizes the Pearson formula to compute the correlation between price and time, adjusting the moving average based on the coefficient of determination (R²).
- **Moving Average Adjustment**: When R² is greater than 0.5, the moving average is updated using a weighted combination of the current SMA and the previous adjusted value, with weights depending on R². For R² less than or equal to 0.5, adjustments are made by subtracting a value proportional to the difference between the current SMA and prior adjusted average.
- **Visualization**: Provides a clear and intuitive display for easy interpretation.
Usage involves identifying bullish trends when price is above the adjusted moving average and bearish trends when below. The indicator can also serve as a dynamic support or resistance level and be combined with other technical tools for signal confirmation.
Đánh giá của khách hàng
5 | 100 % | |
4 | 0 % | |
3 | 0 % | |
2 | 0 % | |
1 | 0 % |


![Logo "[Hamster-Coder] Bollinger Bands"](https://cdn.ctrader.com/image/webp/21d8e5d6-fb11-4bac-b9ee-cd05c2b76804_30327)

![Logo "[Stellar Strategies] Inside Bar with Signals"](https://cdn.ctrader.com/image/webp/1d9e8bfa-3b2c-4440-bb37-5856902008a7_30683)


