Mô tả
TRB — Chỉ báo Thanh chạy Tick
Phát hiện Thông tin Thị trường Trước khi Giá Di chuyển
Giá giới thiệu có thời hạn dành cho người dùng đầu tiên - đảm bảo bản sao của bạn ngay bây giờ với mức giá giảm trước khi giá tăng lên mức bán lẻ tiêu chuẩn khi kết thúc giai đoạn phát hành ban đầu.
Phiên bản 1.1
Sử dụng phần Bình luận để hỏi thêm chi tiết
Có sẵn phiên Video với Hướng dẫn Cài đặt sau khi mua
CHỈ BÁO THANH CHẠY TICK (TRB)
Tick Runs Bars mở rộng phân tích cấu trúc vi mô thị trường bằng cách phát hiện sự kiên trì theo hướng trong dòng giao dịch. Cũng dựa trên cuốn Advances in Financial Machine Learning của Marcos López de Prado, chỉ báo này xác định khi áp lực thị trường một chiều lệch khỏi mức dự kiến — tiết lộ việc cắt đơn hàng tổ chức và hoạt động giao dịch phối hợp.
Ý tưởng Cốt lõi
Các nhà giao dịch tổ chức thực hiện các đơn hàng lớn một cách chiến lược — họ chia nhỏ thành các phần nhỏ hơn, giấu khối lượng phía sau các lệnh iceberg, hoặc sử dụng thực thi thuật toán để tránh làm thị trường biến động. Những chiến thuật này để lại dấu vân tay đặc trưng dưới dạng các chuỗi giao dịch một chiều kiên trì. Tick Runs Bars phát hiện các mẫu này bằng cách đo thời gian một bên chiếm ưu thế trong dòng lệnh, tiết lộ khi nào việc đặt lệnh có chủ ý và quyết liệt đang diễn ra thay vì các biến động giá ngẫu nhiên.
Cách Hoạt động
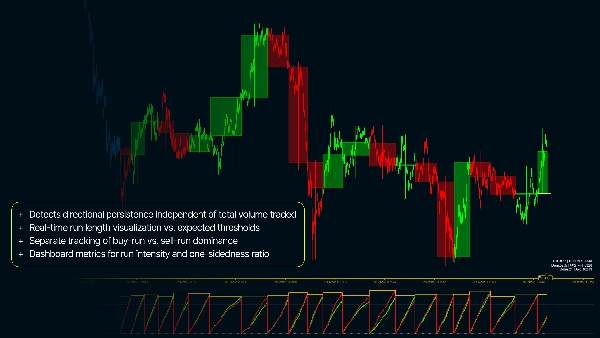
Chỉ báo tính toán độ dài khối lượng mua chạy và khối lượng bán chạy riêng biệt — không trừ lẫn nhau như các chỉ số mất cân bằng truyền thống. Nó theo dõi tích lũy khối lượng một chiều tối đa (θT) so với ngưỡng kỳ vọng động được lấy từ xác suất mua/bán lịch sử và khối lượng trung bình. Khi các chuỗi hướng thực tế vượt quá kỳ vọng, một thanh TRB mới được kích hoạt. Điều này tiết lộ "hình dạng cấu trúc" của việc thực thi dòng lệnh — dấu hiệu của các nhà tổ chức đang hoạt động.
Tính Năng Chính
- Phát hiện sự kiên trì theo hướng độc lập với tổng khối lượng giao dịch
- Hiển thị độ dài chuỗi thời gian thực so với ngưỡng kỳ vọng
- Theo dõi riêng biệt sự chiếm ưu thế của mua chạy và bán chạy
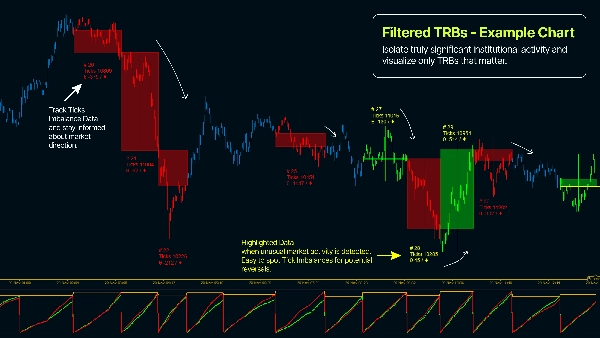
- Tô màu nến biểu đồ theo thành viên TRB thể hiện các giai đoạn thực thi lệnh
- Bộ lọc Khối lượng Tối thiểu để cô lập hoạt động tổ chức thực sự quan trọng
- Các chỉ số bảng điều khiển về cường độ chuỗi và tỷ lệ một chiều
- Cấu hình Kích thước Thanh Kỳ vọng và tham số EWMA phù hợp với biến động công cụ
Tại sao nên dùng Tick Runs Bars?
- Xác định việc thực thi lệnh tổ chức theo thời gian thực — trước khi hoàn thành
- Phát hiện thanh khoản ẩn và mẫu lệnh iceberg qua phân tích dòng chảy
- Phân biệt giao dịch phối hợp với nhiễu thị trường ngẫu nhiên
- Nắm bắt chuyển động giá từ mất cân bằng lệnh cấu trúc, không chỉ là bất thường thống kê
- Thời điểm vào/ra trong các giai đoạn có sự tham gia tổ chức rõ ràng
- Áp dụng lý thuyết cấu trúc vi mô thị trường tiên tiến để có lợi thế trên khung thời gian nhanh hơn
- Giảm tín hiệu sai từ các đột biến giao dịch nhỏ lẻ


