Mô tả
Phân Tích Khối Lượng Chuyên Nghiệp với Tính Toán Delta Dựa Trên Nến Thông Minh
Mở khóa sức mạnh của phân tích khối lượng cấp độ tổ chức với HỒ SƠ KHỐI LƯỢNG NẾN DELTA CỐ ĐỊNH, chỉ báo hồ sơ khối lượng cố định tiên tiến nhất dành cho cTrader. Được thiết kế cho các nhà giao dịch nghiêm túc yêu cầu cái nhìn thị trường chính xác, chỉ báo này tiết lộ nơi hoạt động thị trường thực sự diễn ra thông qua tính toán delta dựa trên nến thông minh.
🎯 TÍNH NĂNG CHÍNH
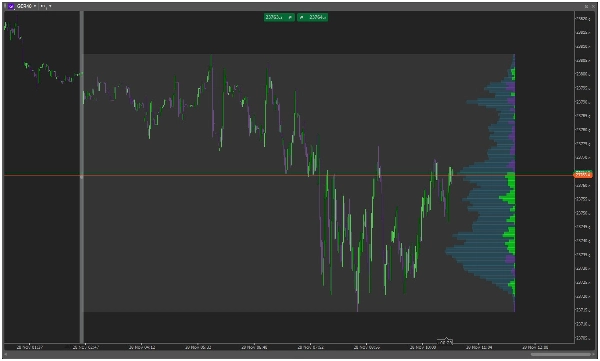
🏓 HỆ THỐNG CỐ ĐỊNH THÔNG MINH
- Chỉ cần vẽ một đường thẳng đứng bất kỳ trên biểu đồ của bạn
- Tự động tạo hồ sơ cố định tại điểm bạn chọn
- Cập nhật động khi hành động giá mới phát triển
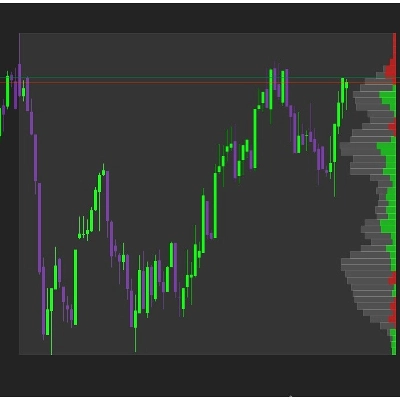
📊 DELTA DỰA TRÊN NẾN THÔNG MINH
- Phân tích delta nâng cao dựa trên hướng nến
- Nến xanh = Khối lượng mua | Nến đỏ = Khối lượng bán
- Hiển thị đơn sắc sạch sẽ theo từng mức giá
- Nhận diện ngay lập tức các vùng áp lực mua/bán
🎨 THIẾT KẾ HÌNH ẢNH TÙY CHỈNH
- Chiều rộng hồ sơ có thể điều chỉnh (5-100% phạm vi)
- Màu sắc tùy chỉnh cho khối lượng mua/bán/tổng
- Điều khiển độ trong suốt để tích hợp biểu đồ hoàn hảo
- Tô bóng chuyên nghiệp để tăng khả năng đọc
⚡ CHẾ ĐỘ HIỂN THỊ LINH HOẠT
- Chế Độ Delta: Xem áp lực mua/bán ròng tại mỗi mức giá
- Chế Độ Khối Lượng: Hiển thị hồ sơ khối lượng truyền thống
- Cố định bên phải để tận dụng tối ưu không gian biểu đồ
🚀 TẠI SAO CÁC NHÀ GIAO DỊCH YÊU THÍCH NÓ
"Cuối cùng, một hồ sơ khối lượng thực sự hiệu quả! Tính toán delta dựa trên nến cực kỳ chính xác để phát hiện hoạt động tổ chức." - Nhà Giao Dịch Chuyên Nghiệp
"Thay đổi cuộc chơi cho phân tích hồ sơ thị trường của tôi. Hệ thống cố định thật tuyệt vời và cách tiếp cận dựa trên nến rất hợp lý." - Chuyên Gia Phân Tích Tổ Chức
📈 PHÙ HỢP CHO
- Nhà Giao Dịch Hồ Sơ Thị Trường - Xác định vùng giá trị và đỉnh/đáy kém
- Nhà Lý Thuyết Thị Trường Đấu Giá - Hiểu quá trình phát triển thị trường
- Chiến Lược Dựa Trên Khối Lượng - Xác nhận phá vỡ với xác thực khối lượng
- Phân Tích Dòng Tiền Tổ Chức - Phát hiện tích lũy/phân phối tiền thông minh
🛠 DỄ DÀNG SỬ DỤNG
- Vẽ một đường thẳng đứng tại điểm cố định của bạn
- Quan sát khi HỒ SƠ KHỐI LƯỢNG NẾN DELTA CỐ ĐỊNH tự động tạo ra
- Phân tích sự phân bố delta trên các mức giá
- Giao dịch với sự tự tin sử dụng các mức được xác nhận bởi khối lượng
🔧 THÔNG SỐ KỸ THUẬT
- Tính toán thời gian thực
- Tiêu thụ tài nguyên thấp
- Tương thích với tất cả các khung thời gian
- Hoạt động với tất cả các công cụ (Forex, Cổ phiếu, Tiền điện tử, Hợp đồng tương lai)
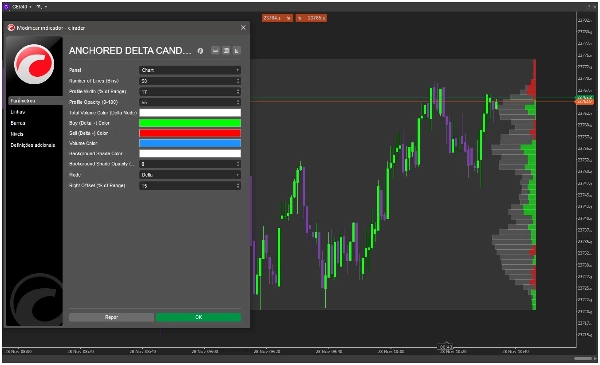
📋 THAM SỐ BAO GỒM
- Số lượng Đường/Ô (5-100)
- Phần trăm Chiều rộng Hồ sơ
- Điều khiển Độ mờ
- Bảng màu Tùy chỉnh
- Điều chỉnh Độ lệch bên phải
- Chế độ Hiển thị (Delta/Khối lượng)
🎯 BIẾN ĐỔI PHÂN TÍCH BIỂU ĐỒ CỦA BẠN NGAY HÔM NAY!
Tham gia cùng hàng ngàn nhà giao dịch chuyên nghiệp đã nâng tầm phân tích thị trường của họ với HỒ SƠ KHỐI LƯỢNG NẾN DELTA CỐ ĐỊNH. Ngừng đoán mò và bắt đầu nhìn thấy nơi hoạt động thị trường thực sự diễn ra thông qua tính toán delta dựa trên nến chính xác.
⭐ "Sự rõ ràng mà chỉ báo này mang lại cho phân tích khối lượng là vô song. Cách tiếp cận delta dựa trên nến thật sự là một phát minh thiên tài."
Thêm HỒ SƠ KHỐI LƯỢNG NẾN DELTA CỐ ĐỊNH vào nền tảng cTrader của bạn ngay hôm nay và giao dịch với cái nhìn sâu sắc cấp tổ chức!


