Mô tả
🚀 VWAP TỔ CHỨC - Chỉ Báo Giao Dịch Chuyên Nghiệp
Giao dịch như các Ngân hàng và Quỹ Phòng hộ với Giá Trung bình Trọng số Khối lượng thực sự
VWAP TỔ CHỨC là công cụ chính xác mà các nhà giao dịch tổ chức, nhà tạo lập thị trường và các bộ phận chuyên nghiệp sử dụng để xác định giá trị công bằng và thực hiện các lệnh lớn mà không làm biến động thị trường. Hiện có sẵn cho các nhà giao dịch bán lẻ muốn nhìn thị trường qua con mắt tổ chức.
💎 Tại sao VWAP là Chỉ Báo Quan Trọng Nhất cho Giao Dịch Tổ Chức
VWAP (Giá Trung bình Trọng số Khối lượng) không chỉ là một đường trung bình động khác - nó là giá chuẩn mực mà các tổ chức sử dụng để đo lường chất lượng thực hiện của họ. Khi một ngân hàng thực hiện lệnh 50 triệu đô la, họ được đánh giá dựa trên việc họ mua cao hơn hay thấp hơn VWAP. Đây là tiêu chuẩn tổ chức.
✨ Điều Gì Làm Cho VWAP Này Khác Biệt:
🎯 Đặt Lại Theo Phiên
- Tự động đặt lại khi thị trường mở cửa (giờ có thể tùy chỉnh)
- Tính toán VWAP nội ngày thực sự, không mang từ các ngày trước
- Hiển thị cho bạn "giá công bằng" chỉ của phiên HÔM NAY
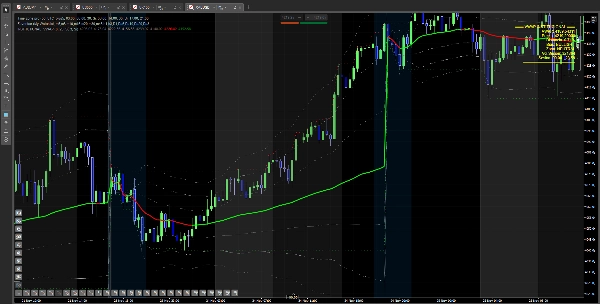
📊 Dải Độ Lệch Chuẩn Ba Lần
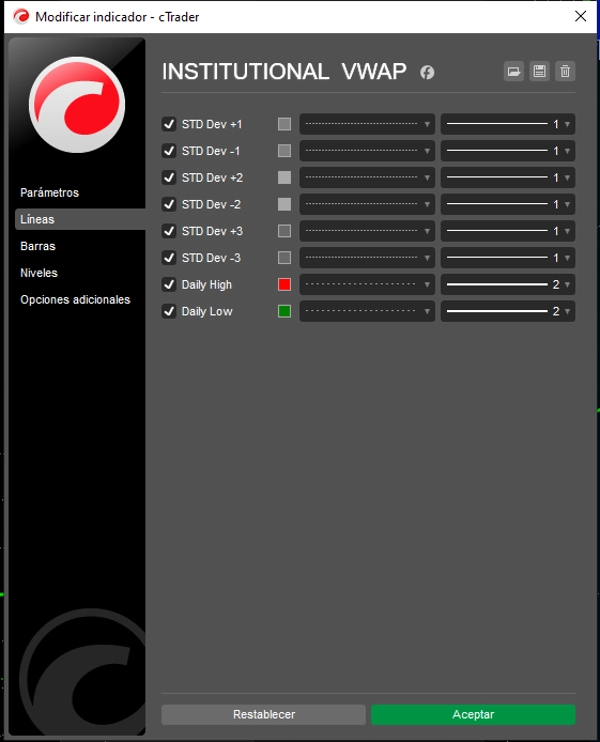
- 3 cấp độ dải độ lệch chuẩn thống kê (±1σ, ±2σ, ±3σ)
- Xác định khi giá bị mua quá mức hoặc bán quá mức theo thống kê
- 68% hành động giá nằm trong ±1σ, 95% trong ±2σ, 99,7% trong ±3σ
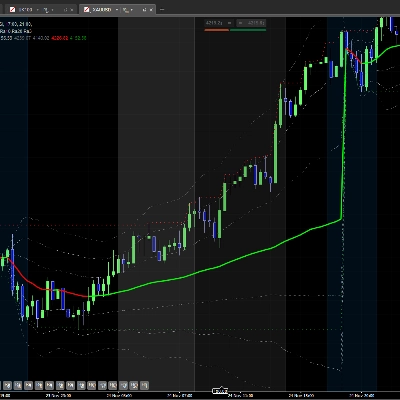
🎨 Đường VWAP Mã Màu Động
- MÀU XANH khi VWAP đang tăng (áp lực mua tổ chức)
- MÀU ĐỎ khi VWAP đang giảm (áp lực bán tổ chức)
- Xác nhận trực quan ngay lập tức về tâm lý tổ chức
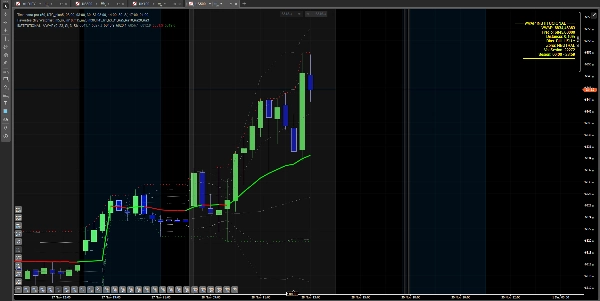
📈 Các Mốc Cao/Thấp Hàng Ngày
- Tự động theo dõi và hiển thị mức cao và thấp của phiên
- Các mức chính nơi các điểm dừng tích tụ (vùng thanh khoản)
- Các nhà giao dịch tổ chức nhắm đến các mức này để đảo chiều
🔍 Vùng Tổ Chức Thời Gian Thực
- "EJECUCIÓN ÓPTIMA" - Giá gần VWAP (vùng vào lệnh tốt nhất)
- "SOBREEXTENDIDO" - Giá xa VWAP (có khả năng đảo chiều)
- "NEUTRAL" - Hành động giá bình thường
🎯 Cách Các Nhà Giao Dịch Tổ Chức Sử Dụng VWAP
Chiến lược 1: Giao dịch theo Dòng Tiền Tổ Chức
Khi VWAP MÀU XANH (Tăng): Các tổ chức đang tích lũy (mua). Điều này có nghĩa là:
- Ưu thế mua - chỉ tìm cơ hội mua
- Chờ đợi giá hồi về đường VWAP
- Vào lệnh khi giá chạm VWAP và bật lên
- Dừng lỗ: dưới VWAP hoặc dưới dải -1σ
Khi VWAP MÀU ĐỎ (Giảm): Các tổ chức đang phân phối (bán). Điều này có nghĩa là:
- Ưu thế bán - chỉ tìm cơ hội bán
- Chờ đợi giá tăng lên đường VWAP
- Vào lệnh khi giá chạm VWAP và bị từ chối
- Dừng lỗ: trên VWAP hoặc trên dải +1σ
Tại sao nó hiệu quả: Bạn đang giao dịch THEO tiền lớn, không phải chống lại họ. Khi các tổ chức mua, con đường ít kháng cự nhất là LÊN.
Chiến lược 2: Quay Về Trung Bình từ Các Dải Cực Đoan
Thiết lập: Giá chạm dải ±2σ hoặc ±3σ (vượt quá giá trị công bằng)
Thực tế Thống kê:
- Chỉ 5% thời gian giá nằm ngoài ±2σ
- Chỉ 0,3% thời gian giá nằm ngoài ±3σ
- Khả năng quay về VWAP rất cao
Giao dịch của bạn:
- Giá tại dải +3σ = Khả năng cao BÁN trở lại VWAP
- Giá tại dải -3σ = Khả năng cao MUA trở lại VWAP
- Mục tiêu: đường VWAP
- Dừng: Vượt ra ngoài dải cực đoan
Tại sao nó hiệu quả: Bạn đang sử dụng thống kê. Khi giá cách trung bình 3 độ lệch chuẩn, xác suất rất cao là sẽ quay về trung bình (VWAP).
Chiến lược 3: Vào Lệnh Hồi Lại Tổ Chức
Thiết lập Hoàn hảo:
- VWAP MÀU XANH (tổ chức đang mua)
- Giá di chuyển mạnh ra khỏi VWAP (chạm +1σ hoặc +2σ)
- Giá hồi về phía VWAP
- Giá chạm đường VWAP nhưng VWAP vẫn MÀU XANH
- VÀO LỆNH MUA - Các tổ chức vẫn đang mua khi giá giảm
Tại sao đây là vàng: Bạn đang mua ở "giá công bằng" của tổ chức trong một xu hướng tăng đã được xác nhận. Đây chính là cách các quỹ phòng hộ tích lũy vị thế - họ chia lệnh thành nhiều phần và mua mỗi khi giá hồi về VWAP.
Chiến lược 4: Tránh Bẫy - Khi KHÔNG NÊN Giao Dịch
KHÔNG MUA khi:
- Giá trên dải +2σ (vượt quá, có khả năng hồi giá)
- VWAP MÀU ĐỎ nhưng giá bật lên từ các dải thấp hơn (bật lại giả)
- Giá cắt ngang VWAP liên tục (biến động mạnh, không có hướng tổ chức rõ ràng)
KHÔNG BÁN khi:
- Giá dưới dải -2σ (bán quá mức, có khả năng bật lại)
- VWAP MÀU XANH nhưng giá bị từ chối từ các dải trên (chỉ là chốt lời)
- Bạn đang trong xu hướng mạnh - không giao dịch ngược xu hướng
🔥 Điều Gì Làm CHO VWAP TỔ CHỨC Vượt Trội
Các chỉ báo VWAP tiêu chuẩn tính từ lúc thị trường mở cửa, không đặt lại đúng cách, chỉ hiển thị đường cơ bản, không có dải độ lệch, không cung cấp bối cảnh vùng, và không cho biết xu hướng bằng màu sắc.
VWAP TỔ CHỨC tính toán trung bình trọng số khối lượng thực sự với việc đặt lại phiên đúng cách, bao gồm giờ phiên có thể tùy chỉnh, hiển thị 3 cấp độ dải độ lệch chuẩn, cung cấp phân tích vùng thời gian thực (tối ưu/vượt quá), có chỉ báo xu hướng mã màu (xanh/đỏ), và hiển thị các mức tham chiếu cao/thấp hàng ngày.
Đây là sự khác biệt giữa một chỉ báo cơ bản và một công cụ giao dịch chuyên nghiệp.
💰 Các Tình Huống Giao Dịch Thực Tế
Tình huống 1: Tích Lũy Tổ Chức US30 mở cửa. VWAP bắt đầu tính từ lúc mở cửa. Suốt buổi sáng, VWAP giữ MÀU XANH và giá liên tục bật lên từ đó. Mỗi lần giá chạm VWAP, bạn mua. Bạn thực hiện 4 giao dịch, tất cả đều thắng. Tại sao? Vì các tổ chức đã tích lũy cả ngày, và bạn đã mua cùng họ ở giá công bằng.
Tình huống 2: Giao Dịch Quay Về Trung Bình GBP/USD tăng vọt lên dải +3σ do tin tức. Mọi người đều phấn khích. Bạn BÁN KHỐNG. Tại sao? Vì giá đang cao hơn giá trị công bằng 3 độ lệch chuẩn - thống kê nói rằng nó PHẢI quay về VWAP. 30 phút sau, giá trở lại VWAP. Bạn kiếm được 60 pip trong khi người khác đuổi theo.
Tình huống 3: Tránh Bẻ Đỉnh Giả Vàng phá vỡ mức cao hàng ngày. Hầu hết các nhà giao dịch mua theo đà phá vỡ. Bạn kiểm tra VWAP - nó MÀU ĐỎ (giảm). Bạn đứng ngoài. Giá đảo chiều và giảm 100 điểm. VWAP đã cho bạn biết các tổ chức không mua - đó là bẫy nhà đầu tư cá nhân.
🎓 Ai Cần Chỉ Báo Này?
✅ Nhà Giao Dịch Trong Ngày - VWAP là chuẩn mực nội ngày
✅ Scalpers - Vào lệnh hoàn hảo khi chạm VWAP
✅ Nhà Giao Dịch Tổ Chức - Đã sử dụng VWAP, giờ với hình ảnh tốt hơn
✅ Nhà Giao Dịch Tiền Thông Minh - Theo dõi dòng tiền lớn
✅ Bất kỳ ai nghiêm túc về giao dịch - Đây là cách các chuyên gia giao dịch
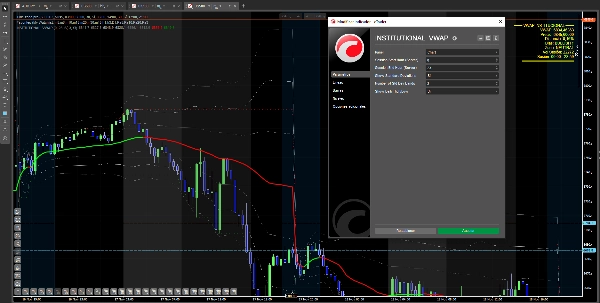
⚙️ Hoàn Toàn Có Thể Tùy Chỉnh
- Giờ phiên - Đặt giờ mở/đóng thị trường của bạn (London, New York, Châu Á)
- Dải độ lệch chuẩn - Chọn 1, 2 hoặc 3 dải
- Mức cao/thấp hàng ngày - Bật/tắt
- Tùy chọn hiển thị - Tùy chỉnh màu sắc và kiểu dáng
🛡️ Quản Lý Rủi Ro Tích Hợp
Các dải độ lệch chuẩn LÀ quản lý rủi ro của bạn:
Kích thước vị thế:
- Vào lệnh gần VWAP = vị thế lớn hơn (rủi ro thấp hơn)
- Vào lệnh tại ±2σ = vị thế nhỏ hơn (rủi ro cao hơn)
- Không bao giờ vào lệnh vượt ±3σ (chờ quay về)
Vị trí đặt dừng lỗ:
- Giao dịch mua: Dưới VWAP hoặc dải -1σ
- Giao dịch bán: Trên VWAP hoặc dải +1σ
- Quay về trung bình: Vượt ra ngoài dải cực đoan bạn đang giao dịch
Mục tiêu lợi nhuận:
- Từ VWAP đến dải ±1σ (thận trọng)
- Từ VWAP đến dải ±2σ (vừa phải)
- Từ dải ±3σ trở lại VWAP (quay về trung bình mạnh mẽ)
🚀 Lợi Thế Giao Dịch Bạn Đã Bỏ Lỡ
VWAP trả lời ba câu hỏi quan trọng nhất trong giao dịch:
✅ Giá trị công bằng là gì? - Đường VWAP
✅ Giá rẻ hay đắt? - Các dải độ lệch
✅ Các tổ chức đang mua hay bán? - Màu sắc của VWAP (xanh/đỏ)
Với VWAP TỔ CHỨC, bạn không còn đoán mò nữa. Bạn đang giao dịch với dữ liệu, thống kê và dòng tiền tổ chức.
📈 Hoạt động trên tất cả các thị trường và khung thời gian
- Forex - Mọi cặp chính và phụ
- Chỉ số - US30, SPX500, UK100, NAS100, GER40
- Hàng hóa - Vàng, Bạc, Dầu, Khí tự nhiên
- Tiền điện tử - Bitcoin, Ethereum, Altcoins
- Khung thời gian - 1 phút đến 1 giờ (tập trung nội ngày)
Lưu ý: VWAP chủ yếu là công cụ nội ngày. Nó đặt lại mỗi phiên, làm cho nó hoàn hảo cho giao dịch trong ngày và scalping.
🎁 Bắt đầu giao dịch với trí tuệ tổ chức
Ngừng giao dịch mù quáng. Ngừng đoán giá "nên" ở đâu. Bắt đầu giao dịch với cùng một chuẩn mực mà các ngân hàng và quỹ phòng hộ sử dụng.
Xem giá công bằng. Giao dịch ở các cực đoan. Theo dõi tiền tổ chức.
Chỉ báo này tương thích với nền tảng cTrader. Mua một lần, cập nhật trọn đời.


