

Mô tả
Mô tả sản phẩm: Bảng Hiệu Suất BullMoon
Bảng Hiệu Suất BullMoon là một công cụ phân tích mạnh mẽ cho cTrader, được thiết kế để giúp các nhà giao dịch theo dõi hiệu suất của họ theo thời gian thực và tái hiện trực quan các giao dịch trước đây ngay trên biểu đồ.
1. Dữ liệu và Điều kiện Thị trường
Bảng phân tích dữ liệu giao dịch liên quan đến tài khoản của bạn và dữ liệu giá lịch sử của ký hiệu được chọn.
- Nó đánh giá cả các giao dịch đã đóng và đang chạy để tính toán các chỉ số chính như lợi nhuận ròng, mức giảm tối đa và tỷ lệ thắng.
- Chỉ báo quét lịch sử của bạn để xác định chính xác điểm vào và điểm ra.
2. Giải thích Tín hiệu và Các yếu tố Hình ảnh
Để làm cho việc phân tích trực quan nhất có thể, công cụ sử dụng các dấu hiệu hình ảnh rõ ràng ngay trên biểu đồ:
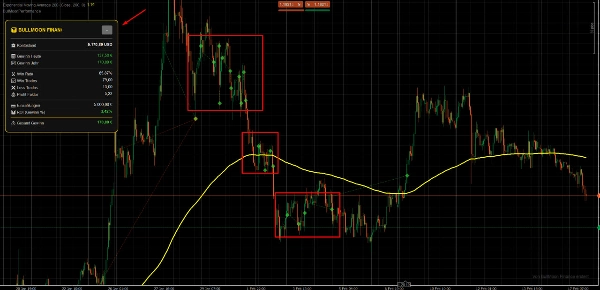
- Ký hiệu: Các điểm vào và ra được đánh dấu bằng các ký hiệu cụ thể (ví dụ: mũi tên hoặc chấm), cho phép bạn thấy ngay vị trí mở và đóng lệnh.
- Đường hình ảnh: Các đường nối các ký hiệu này minh họa thời gian giao dịch, làm cho các giai đoạn lợi nhuận hoặc thua lỗ trở nên rõ ràng về mặt hình ảnh.
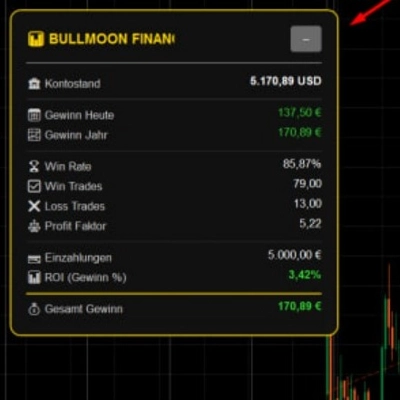
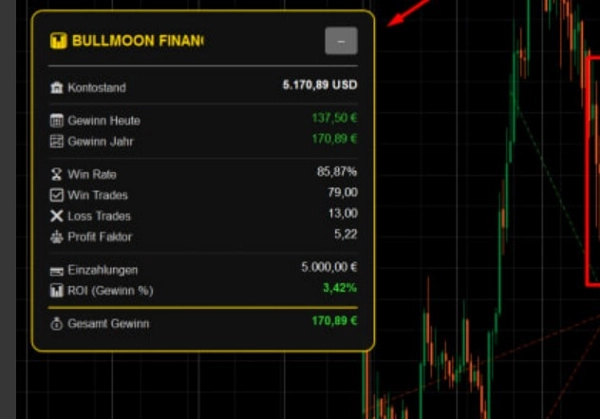
- Bảng điều khiển: Một bảng điều khiển nhỏ gọn trên màn hình cung cấp các dữ kiện cụ thể, bao gồm lợi nhuận bằng USD, tổng số lot đã giao dịch và hệ số R.
3. Cài đặt và Tham số Chính
Bạn có thể tùy chỉnh bảng để phù hợp với phong cách giao dịch cụ thể của mình:
- Khoảng thời gian Lịch sử: Xác định số ngày giao dịch trong quá khứ sẽ được hiển thị trên biểu đồ.
- Hình ảnh: Màu sắc cho các giao dịch thắng và thua, cũng như độ trong suốt của các đường và ký hiệu, đều có thể điều chỉnh hoàn toàn.
- Cơ sở Tính toán: Đặt kích thước lot cố định hoặc rủi ro theo tỷ lệ phần trăm cho kết quả thống kê.
4. Các Trường hợp Sử dụng và Kịch bản Giao dịch Thông thường
- Phân tích Sau Giao dịch: Xem lại ngày giao dịch của bạn để đảm bảo bạn đã tuân thủ đúng chiến lược.
- Tối ưu hóa Chiến lược: Nhận biết trực quan xem mức Take Profit hoặc Stop Loss của bạn có thường được đặt quá chặt hoặc quá rộng hay không.
- Giám sát Trực tiếp: Theo dõi hiệu suất hàng ngày hiện tại của bạn mà không cần phải chuyển đổi qua lại tab lịch sử tài khoản.
5. Đối tượng Mục tiêu (Kích thước Tài khoản và Kinh nghiệm)
- Cấp độ Kinh nghiệm: Phù hợp cho người mới bắt đầu muốn có cảm nhận tốt hơn về các giao dịch của họ, cũng như chuyên gia cần kiểm tra hiệu suất nhanh chóng bằng hình ảnh.
- Kích thước Tài khoản: Phù hợp với mọi kích thước tài khoản. Đặc biệt có giá trị cho các nhà giao dịch vận hành nhiều chiến lược cùng lúc và cần duy trì cái nhìn tổng quan rõ ràng.
6. Những Hạn chế và Lưu ý Quan trọng khi Sử dụng
- Nền tảng: Phát triển độc quyền cho cTrader.
- Khả năng Cung cấp Dữ liệu: Việc hiển thị các giao dịch lịch sử phụ thuộc vào dữ liệu có sẵn trong lịch sử tài khoản cTrader của bạn.
- Không phải Bộ tạo Tín hiệu: Xin lưu ý rằng bảng này là một công cụ phân tích và không tạo ra các tín hiệu mua hoặc bán độc lập.
Tóm tắt
The panel features a compact dashboard displaying key statistics including profit in USD, total lots traded, and the R-factor. Users can customize the display period for historical trades, adjust colors and transparency of visual elements, and set calculation parameters based on fixed lot sizes or percentage risk.
Typical use cases include post-trade analysis, strategy optimization by evaluating take profit and stop loss settings, and live monitoring of daily performance without switching views. The tool supports various markets and symbols such as Forex (EURUSD, GBPUSD, USDJPY), Indices (NAS100), Commodities (XAUUSD), Crypto (BTCUSD), and Stocks. It is suitable for traders of all experience levels and account sizes, especially those managing multiple strategies simultaneously. The panel is strictly an analytical tool and does not generate trade signals.
Đánh giá của khách hàng
5 | 100 % | |
4 | 0 % | |
3 | 0 % | |
2 | 0 % | |
1 | 0 % |
Thảo luận
Câu hỏi thường gặp
Sản phẩm khác của tác giả này





![Logo "[Hamster-Coder] Moving Average MTF"](https://cdn.ctrader.com/image/webp/b11b98b1-194d-4b8e-b00e-d611826ad159_31226)











Giá