present
Sign up and get $50 off your first purchase
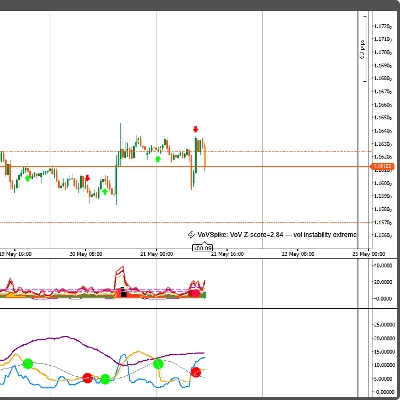
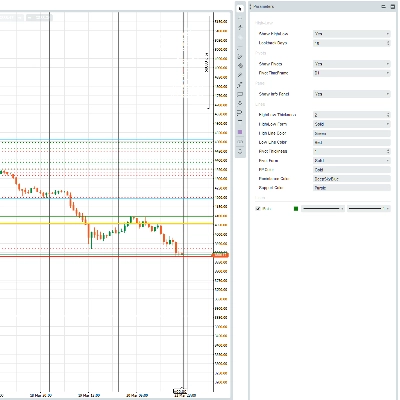
Trading product for PIVOT POINTS, HIGH-LOW OF THE DAY Indicator BTCUSD Forex, image 1
PIVOT POINTS, HIGH-LOW OF THE DAY
Indicator
108 downloads
Version 1.0, Mar 2026
Windows, Mac
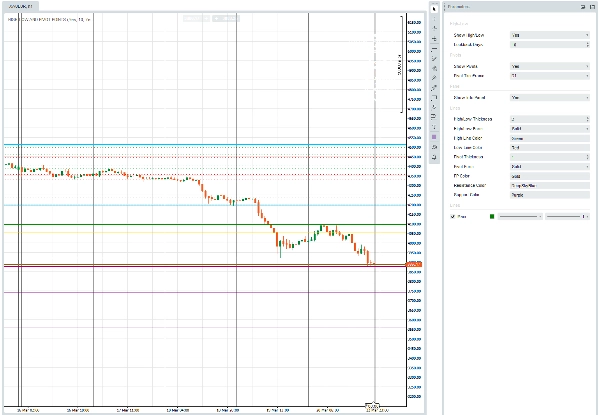
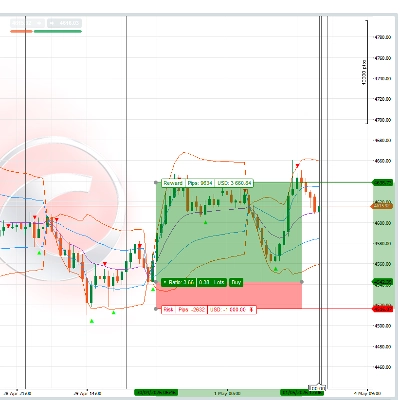
Trading product for PIVOT POINTS, HIGH-LOW OF THE DAY Indicator BTCUSD Forex, image 2
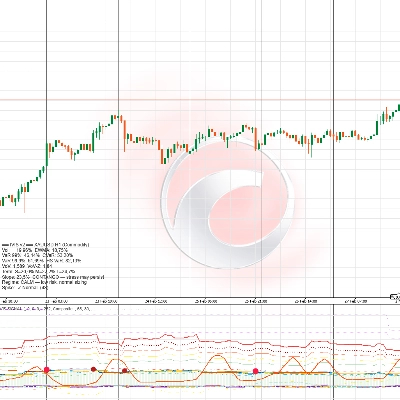
Trading product for PIVOT POINTS, HIGH-LOW OF THE DAY Indicator BTCUSD Forex, image 3
Trading product for PIVOT POINTS, HIGH-LOW OF THE DAY Indicator BTCUSD Forex, image 4
60
Sales
306
Free installs

Description

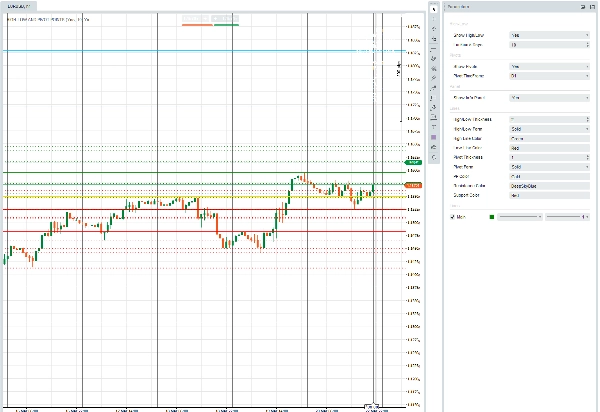
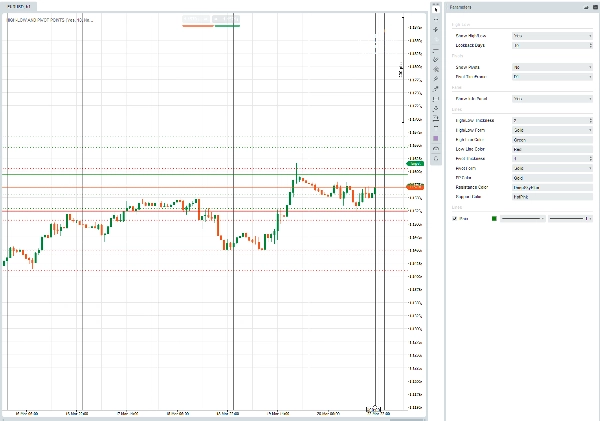
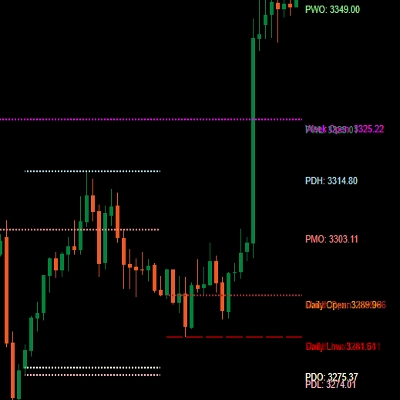
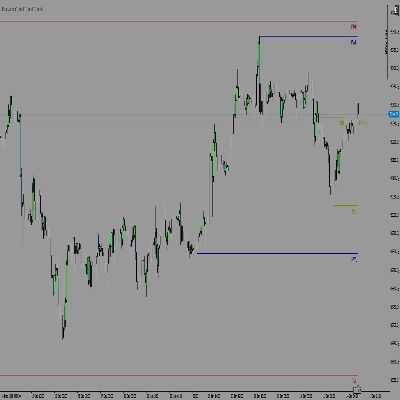
HIGH-LOW AND PIVOT POINTS is a cTrader overlay indicator that plots daily high/low price levels and classic pivot points directly on your chart.

Parameters at a glance:

GroupWhat you control

High-Low

Show/hide lines; how many past days to display (Lookback Days)

Pivots

Show/hide lines; which timeframe drives the pivot calculation (Daily, Weekly, etc.)

Panel

Show/hide the on-chart info box listing current prices and pivot levels

Lines

Thickness, style (Solid / Dotted / VeryDotted), and color for High, Low, PP, Resistance, and Support lines

What it draws:

  • Today's High/Low in your chosen colors; prior lookback days in a lighter/thinner version of the same.
  • Seven standard pivot levels — PP, R1–R3, S1–S3 — calculated from the previous completed bar of your selected pivot timeframe.
  • A top-right info panel summarising live Day High/Low, the multi-day lookback range, and all seven pivot prices.

Summary

AI summary
The "Pivot Points, High-Low of the Day" indicator for cTrader overlays daily high and low price levels along with classic pivot points directly on trading charts. It visually displays today's high and low prices, as well as those from prior days based on a configurable lookback period. The indicator calculates and plots seven standard pivot levels—Pivot Point (PP), Resistance levels R1 to R3, and Support levels S1 to S3—derived from the previous completed bar of a selectable timeframe (e.g., daily or weekly). Users can customize visibility, line thickness, style (solid, dotted, very dotted), and colors for all lines including high, low, pivot, resistance, and support. An optional on-chart info panel summarizes live day high/low, multi-day range, and all pivot prices for quick reference. This tool supports multiple markets and symbols including Forex pairs (EURUSD, GBPUSD, NZDUSD, USDJPY), cryptocurrencies (BTCUSD), commodities (XAUUSD), indices (NAS100), and stocks. It is designed to assist traders in identifying key price levels and potential breakout or reversal points based on historical price data and pivot calculations.
Indicator profile

Customer reviews

0.0
Reviews: 0
Customer reviews
No reviews for this product yet. Already tried it? Be the first to tell others!

Discussion

FAQ

BTCUSD
Forex
Breakout
Indices
EURUSD
Commodities
GBPUSD
NZDUSD
Crypto
Stocks
XAUUSD
NAS100
USDJPY
Products available through cTrader Store, including trading bots, indicators and plugins, are provided by third-party developers and made available for informational and technical access purposes only. cTrader Store is not a broker and does not provide investment advice, personal recommendations or any guarantee of future performance.

More from this author

cBot
VWAP
Signal
+4
Gold Profit Scalper Machine
4
Profit factor
cBot
BTCUSD
EPIC FURY
5.56
Profit factor
Indicator
Signal
Order Flow Market Depth Pro | Footprint & DOM
Indicator
Forex
BTCUSD
+12
Pro Structure Patterns Detector
Indicator
Volume
Moving Average
Multi-Timeframe Rolling Volatility Indicator - Smart Volatility Breakout System
cBot
ATR
Volume
+5
HEDGE GRID STRATEGY PRO Advanced Algorithmic Trading System
7%
ROI
12
Profit factor
Indicator
VWAP
Volume
+2
VWAP Bands and Swing Wick Structure Indicator
cBot
ATR
Aggressive
+4
F655 T053 V10 3.0L FASTET AND MOST PROFITABLE ALGORITHM IN STORE
4.15
Profit factor
Indicator
BTCUSD
Crypto
+5
Predictive volatility spike indicator with 8 anticipatory signals, VaR analytics, and dual-mode buy/sell arrows
Indicator
Prop
BTCUSD
+3
Institutional-grade volatility suite with 4 estimators, VaR/CVaR, spike forecasting & dual-mode buy/sell signals
cBot
AI
NAS100
+5
MAZINGER INFINITY
50
Profit factor
cBot
BOS
Key Levels
+5
MST-EDITION: Smart Money Concepts AlgoTrader
8.4
Profit factor

You may also like

Indicator
ATR
BOS
+5
Know how strong each Supertrend flip is: scored BUY/SELL, structure stop + 3 targets, live win-rate dashboard, alerts.
Indicator
Spot Strong Trends Early & Filter Market Noise
Indicator
Channel
Imbalance
+2
Adaptive volatility channel based on moving average and standard deviation (σ).
Indicator
Forex
EURUSD
+7
Institutional Session Levels Pro OHLC,Prev(D,W,M OHLC)
Indicator
Forex
Crypto
+3
a visually very powerful tool for analyzing "opposing forces".
Indicator
CHOCH
Inducement
+5
TradeLens - Frame the Trade. Refine the Entry. Two Timeframes. One Decision.
Indicator
Forex
Crypto
+3
ICT Advanced Swings Indicator – Multi-Timeframe Precision
Indicator
Fisher Transform with smoothing. Spot reversals and cycles with precision. Great for any market, any timeframe.
Indicator
ATR
RSI
+4
RSI bands drawn on price, confluence-scored BUY/SELL signals, an ATR stop with three targets
Indicator
SMC
Forex
+5
Silver Bullet by LudwigICT
Indicator
ATR
Prop
+14
Optimize exits with Chandelier Exit! Visualize stop-loss points dynamically for improved trading precision and safety.
Indicator
SMC
Prop
+13
Perfect for traders who demand a clear overview of multiple timeframes at a glance.
Indicator
AI
ATR
+26
Session Volume Profile + Composite. POC/VAH/VAL, Focus/Solo. Fast, clean, no ghosts, live-ready.
Indicator
A compact, visual multi-timeframe trend indicator for cTrader. Easily spot bullish or bearish trends across 4 customizab
Indicator
EMA
RSI
+5
MACD Colour Histogram with 11 Moving Average Types, Multi-timeframe confirmation and Sound Signal Alert.
Indicator
BOS
MSS
+5
Your entire ICT session map, structure engine, and key levels — No manual work. One indicator. Every session!
Indicator
ADX
Volume
+2
100% Non-Repainting Buy & Sell Signal indicator with Entry, Stop Loss, and Target levels for cTrader traders.
Indicator
Displays the previous day's, last week's, and last month's highest and lowest price levels on your chart.

Price

60
Sales
306
Free installs