Mô tả
Track correlation divergences before the market corrects.
Most traders know that XAUUSD and DXY move inversely. Or that XAUUSD and XAGUSD tend to move together. What they don't have is a tool that tells them when that relationship breaks down and what to do about it.
Correlation Meter calculates a live Pearson correlation coefficient between any two symbols using log-returns (the statistically correct input for financial data). It then compares that short-term reading against a longer historical average and fires an alert the moment the gap becomes significant.
How it works
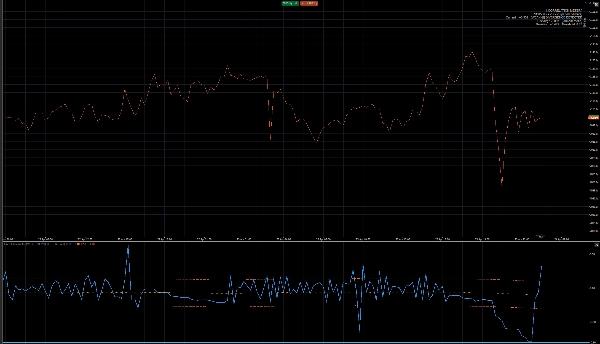
The indicator opens in a sub-window below your chart, similar to RSI. A blue line shows the current 50-bar correlation. An orange dotted line shows the 200-bar historical average. Two red bands mark the divergence threshold. When the blue line breaks outside those bands, the correlation between your two symbols has shifted beyond its normal range meaning one symbol has lagged behind the other and a statistical reversion is probable.
A colour-coded overlay panel in the corner of your chart shows correlation strength at a glance: from Very Strong (≥0.90) down to None (<0.30).
Risk warning
If you hold two highly correlated positions open at the same time. For example XAUUSD long and XAGUSD long with a +0.93 correlation the indicator flags a red warning that your actual risk exposure is nearly double what it appears. Two positions are not two separate bets if they move as one asset.
Pre-configured pairs
Works with any two symbols your broker offers. Suggested starting pairs: XAUUSD/DXY, XAUUSD/XAGUSD, USOIL/USDCAD, EURUSD/DXY, SPX500/VIX.
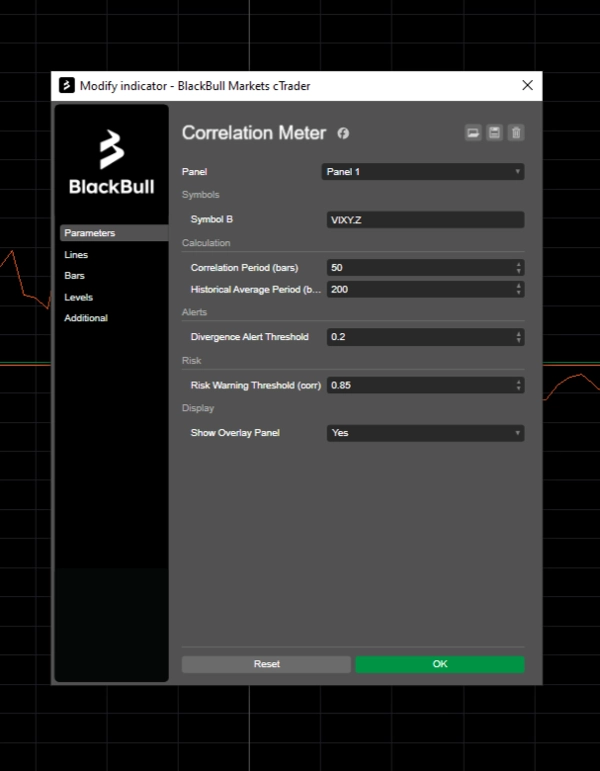
Parameters
All key settings are adjustable: correlation period, historical average period, divergence threshold, and risk warning sensitivity. No coding required.