
Mô tả
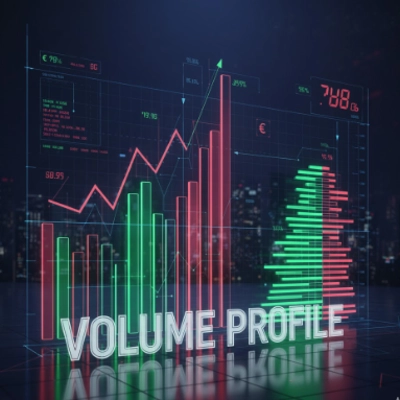
Chỉ báo Đọc Băng: Dựa trên luồng lệnh đọc theo thời gian thực.
Thông tin theo Đường Giá:
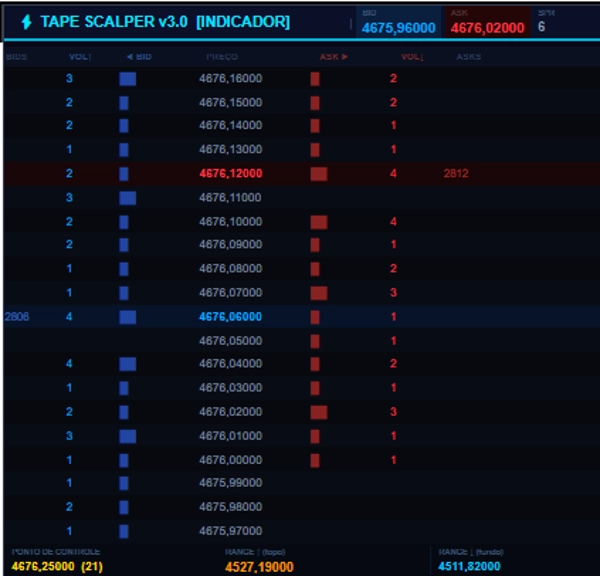
GIÁ: Giá trị chính xác của mức giá.
VOL↑ và VOL↓: Các con số thô chỉ ra có bao nhiêu tick tích cực (mua hoặc bán) xảy ra tại mức giá đó trong cửa sổ phân tích.
Thanh (◄ BID và ASK ►): Các thanh có chiều rộng biến đổi giúp so sánh trực quan về khối lượng. Thanh càng rộng, khối lượng càng lớn.
BIDS / ASKS (mô phỏng): Giá trị được chỉ báo tạo ra để mô phỏng tính thanh khoản, dựa trên giá hiện tại.
Nổi bật trực quan: Mã áp dụng màu sắc và biểu tượng đặc biệt cho các sự kiện quan trọng:
Giá Hiện Tại (BID/ASK): Đường giá Bid chuyển sang màu xanh đậm, và đường Ask chuyển sang màu đỏ đậm.
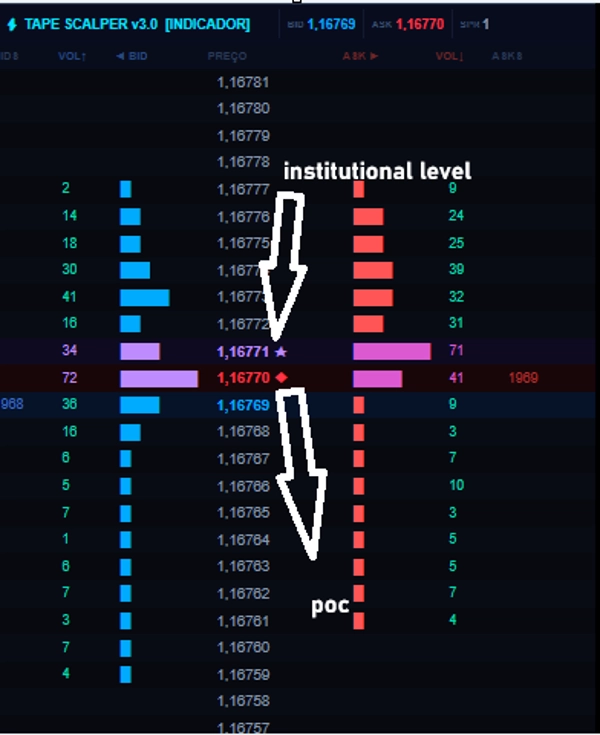
◆ (Kim cương): Chỉ điểm POC (Điểm Kiểm Soát) – mức giá có khối lượng tích lũy cao nhất trong giai đoạn.
★ (Ngôi sao): Chỉ ra rằng khối lượng tại mức đó là của các tổ chức (trên ngưỡng cấu hình).
← (Mũi tên): Chỉ ra rằng giá hiện tại đang ở giới hạn của Phạm vi (Trên hoặc Dưới) được xác định cho chiến lược Breakout.
Màu sắc Thanh và Số:
Xanh lam nhạt / Xanh da trời: Khối lượng Mua bình thường.
Đỏ / Hồng: Khối lượng Bán bình thường.
Xanh lá / Vàng: Khối lượng cực kỳ cao (HiVol).
Tím / Tím nhạt: Khối lượng được phân loại là của Tổ chức.
4. STATSROW (Dòng Thống Kê Dưới)
Hiển thị ba chỉ số bối cảnh quan trọng cho phân tích đọc băng.
Mã Chỉ Số Tên Ý nghĩa
ĐIỂM KIỂM SOÁT POC Mức giá có tổng khối lượng tích lũy cao nhất (tổng mua và bán). Hiển thị giá và tổng khối lượng
RANGE↑ (trên) Mức Cao Phạm vi Giá cao nhất trong phạm vi được xác định bởi chu kỳ thanh (ví dụ, 20 thanh cuối).
RANGE↓ (dưới) Mức Thấp Phạm vi Giá thấp nhất trong phạm vi được xác định bởi chu kỳ thanh.
Tóm tắt cho Danh mục Bán
Khi trình bày chỉ báo này như một sản phẩm, bạn nên nhấn mạnh các thông tin sau đây chỉ hiển thị độc quyền trên bảng điều khiển:
Hiển thị Luồng Lệnh Thời gian Thực: Xem cuộc chiến giữa người mua và người bán từng mức giá.
Nhận diện Mức độ Tổ chức (★): Phân biệt "tiền thông minh" với nhà đầu tư cá nhân trực tiếp trên thang giá.
Điểm Kiểm Soát Động (POC) (◆): Biết chính xác nơi khối lượng đang tập trung hiện tại.
Phát hiện Breakout Trực quan (←): Xem ngay trên thang khi giá chạm vào các cạnh của phạm vi đã định trước.
THỬ PHIÊN BẢN PRO: https://ctrader.com/products/4282
Tóm tắt
Key features include simulated bid and ask liquidity values, visual highlights for important events, and color-coded volume bars: cyan/light blue for normal buy volume, red/pink for normal sell volume, green/yellow for exceptionally high volume, and purple/lilac for institutional volume. Special symbols mark the Point of Control (◆) representing the price level with the highest accumulated volume, institutional volume levels (★), and breakout range limits (←).
A lower statistics row provides contextual metrics such as the Point of Control (POC), Range High (RANGE↑), and Range Low (RANGE↓) over the selected bar period. The indicator supports visualization of institutional activity and breakout detection directly on the price ladder, aiding in detailed tape reading and volume-based market analysis. It requires tick data and outputs visual signals including level touches, breaks, and reversals.