
الوصف
لوحة تحكم الاتجاه والزخم متعددة الأطر الزمنية النهائية هي مجموعة تحليلية متقدمة مصممة لعلاج "فوضى المخططات" مع تزويدك بسياق سوقي بمستوى مؤسسي. من خلال تجميع البيانات الحرجة من أطر زمنية متعددة في لوحة أنيقة وتفاعلية على المخطط، تتيح لك اتخاذ قرارات التداول بسرعة وثقة أعلى. سواء كنت متداول سكالبينج في إطار زمني منخفض أو متداول تأرجح يومي، توفر هذه الأداة رؤى دقيقة حول قوة الاتجاه، والتراجعات المحتملة، والمستويات الهيكلية الرئيسية. مؤشر مصمم للدخول في صفقات شبه تلقائية يدويًا أو باستخدام بوت https://ctrader.com/products/3618
هل هناك إمكانية لعرض الإطار الزمني وأي تركيبة من الأطر الزمنية للمتوسطات المعروضة - مختلفة عن الإطار الزمني الحالي على cTrader
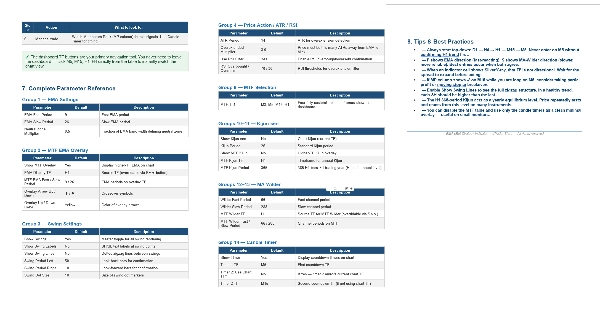
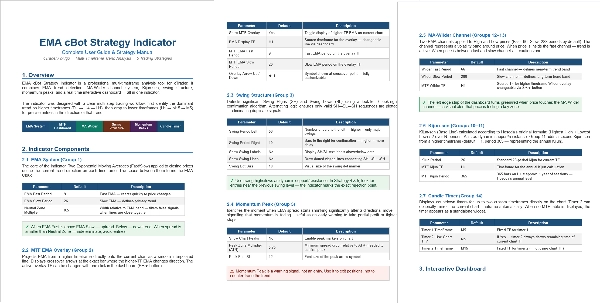
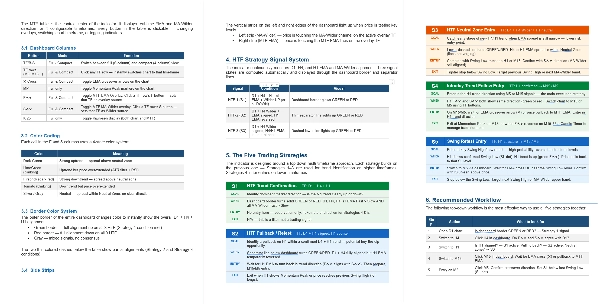
دليل - https://clogic-algo.github.io/EMA_cBot_Strategy_Guide/EMA_Strategy_Guide.html
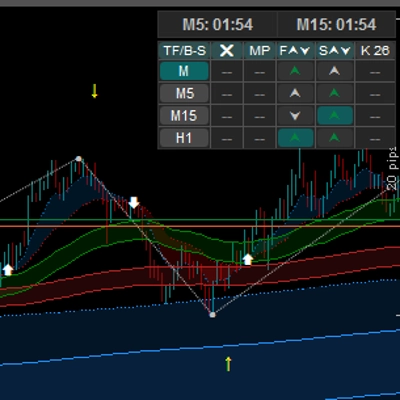
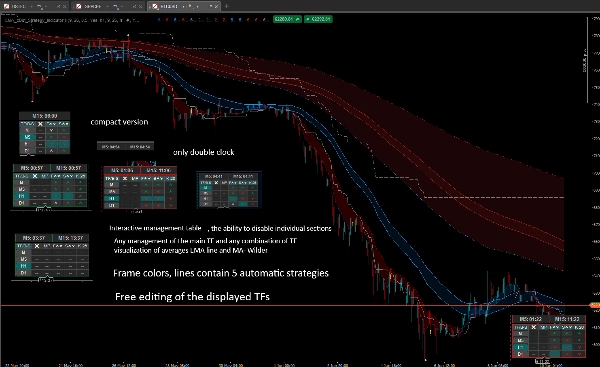
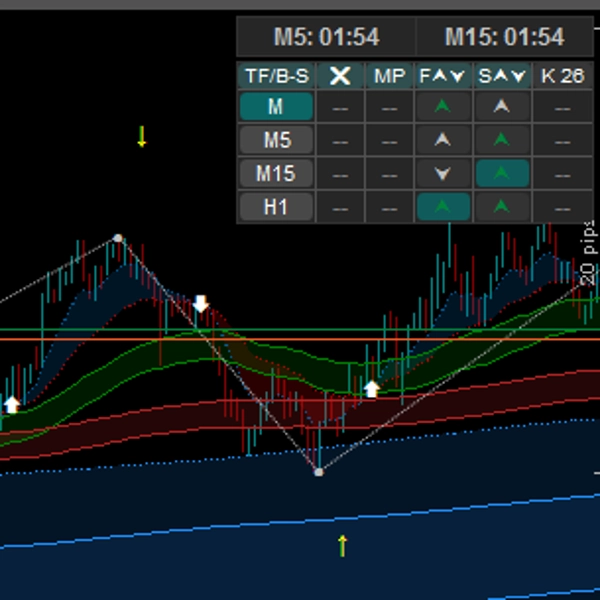
1. لوحة تحكم تفاعلية متعددة الأطر الزمنية (MTF)
- مراقبة حتى 4 أطر زمنية (مثل M1، M5، H1، D1) في نفس الوقت داخل لوحة واجهة مستخدم نظيفة.
- واجهة مستخدم قابلة للنقر: غيّر إطارك الزمني على المخطط فورًا بمجرد النقر على الأزرار في لوحة التحكم!
- وضعيات مدمجة / كاملة: قم بتبديل حجم لوحة التحكم لعرض أو إخفاء المقاييس المتقدمة (EMA، Wilder، Kijun، وإشارات الزخم) لتوفير مساحة الشاشة.
- حدود توافق الأطر الزمنية الأعلى (HTF): يتغير لون حدود لوحة التحكم ديناميكيًا لتنبيهك عندما تكون الأطر الزمنية الأعلى (H1، H4، D1) في توافق كامل.
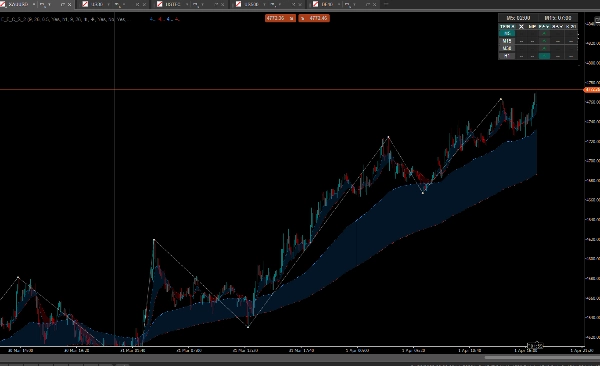
2. هيكل السوق الآلي (قمة التأرجح / قاع التأرجح)
- يحدد ويعلم نقاط التحول تلقائيًا (قمم/قيعان التأرجح) بنقاط مرئية وتسميات نصية.
- اختياريًا، يرسم خطوط التأرجح (بنمط الزجزاج) لتصور موجات السوق وكسر هيكل السوق بسهولة.
- تحكم كامل في حساسية التأرجح (فترات النظر للخلف للشموع اليسرى/اليمنى قابلة للتعديل).
3. المتوسطات المتحركة المتقدمة وسحب الاتجاه
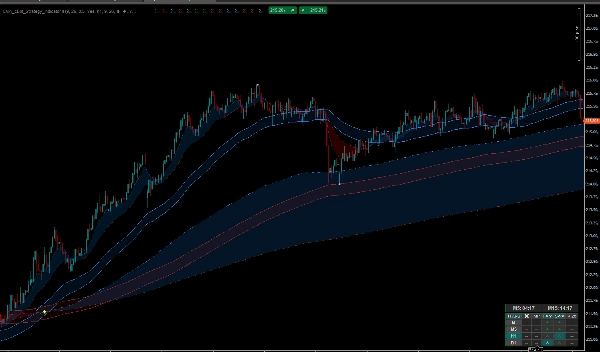
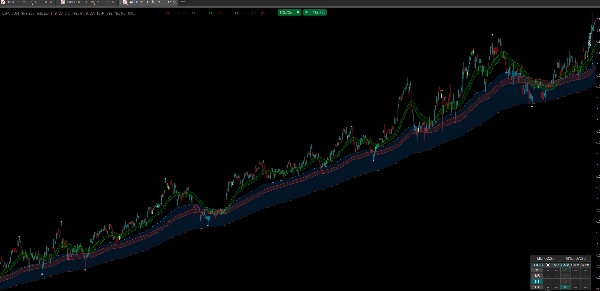
- تصور اتجاه الاتجاه باستخدام "سحب" شفافة مرسومة بين المتوسطات المتحركة السريعة والبطيئة (EMA و MA-Wilder).
- تراكبات MTF حقيقية: ارسم EMA للإطار الزمني الأعلى (مثل EMA ساعة واحدة) مباشرة على مخطط الإطار الزمني الأدنى الحالي (مثل 5 دقائق) بسلاسة وبدون تشويه.
- أسهم وتنبيهات مرئية مدمجة لتقاطع EMA.
4. استنفاد الاتجاه وذروات الزخم
- يستخدم خوارزمية ذكية مع مرشحات ATR و RSI لاكتشاف متى يكون السعر مفرط التمدد بشكل كبير.
- ذروات الزخم: يحلل المؤشر "الفارق" بين المتوسطات السريعة والبطيئة. عندما ينتهي دفع الزخم القوي وتبدأ المتوسطات في الانكماش، يطبع سهم تحذير "ذروة" محدد — أداة ممتازة لرصد التراجعات ومناطق جني الأرباح.
5. دعم إيشيموكو (Kijun-sen)
- قم بتبديل خط Kijun-sen الكلاسيكي ليعمل كدعم/مقاومة ديناميكي.
- يشمل خيار MTF Kijun لعرض الخط الأساسي من إطار زمني أعلى على مخططك الحالي.
6. شرائط حالة الحافة ومؤقت الشمعة المزدوج
- "شرائط الحافة" الملونة المتقطعة بجانب لوحة التحكم تعطيك قراءة بصرية فورية لانحياز اتجاه الإطار الزمني الأعلى، مما يضمن عدم التداول عكس الاتجاه الكلي.
- مؤقت عد تنازلي مزدوج مدمج يعرض الوقت المتبقي للشمعة الحالية و شمعة إطار زمني أعلى (مثل M5 و H1) في نفس الوقت.
⚙️ التخصيص النهائي:
تم بناء هذا المؤشر ليتكيف مع استراتيجيتك. لديك تحكم كامل في:
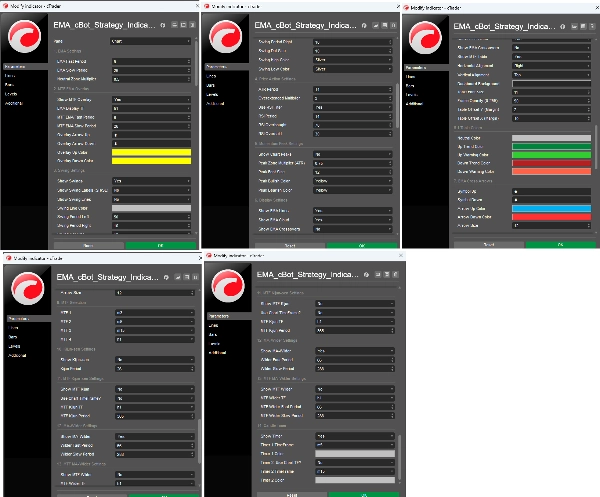
- الفترات والمعلمات لجميع المتوسطات المتحركة (EMA، Wilder، Kijun).
- تخصيص كامل لألوان واجهة المستخدم (السحب، خلفية اللوحة، النص، تحذيرات الاتجاه).
- تموضع لوحة التحكم (يسار/يمين، أعلى/أسفل)، الهوامش، والشفافية.
- عتبات مرشحات ATR و RSI للقضاء على الإشارات الخاطئة.
لمن هذا المؤشر؟
- متبعو الاتجاه الذين يسعون لمزامنة دخولهم مع زخم الأطر الزمنية الأعلى.
- متداولو حركة السعر الذين يعتمدون على هيكل السوق الدقيق لقمم/قيعان التأرجح.
- المتداولون اليوميون والسكالبيرز الذين يحتاجون إلى قراءة مستمرة لاتجاهات H1/H4/D1 دون ازدحام مساحة عملهم بنوافذ متعددة.
قم بتحسين مساحة شاشتك واكسب ميزة ضخمة مع سياق متعدد الأطر الزمنية الحقيقي. قم بتثبيت لوحة التحكم اليوم وقم بتكييفها تمامًا مع أسلوب تداولك!
الملخص
Key features include visualization of trend direction through transparent clouds between fast and slow moving averages (EMA and Wilder MA), true MTF overlays that plot higher timeframe EMAs on lower timeframe charts without distortion, and built-in alerts for EMA crossovers. It incorporates a smart algorithm with ATR and RSI filters to detect trend exhaustion and momentum peaks, signaling potential pullbacks or take-profit zones.
The indicator also supports Ichimoku Kijun-sen lines as dynamic support/resistance, with multi-timeframe options. Additional tools include color-coded edge status strips indicating higher timeframe trend bias and a dual candle countdown timer for current and higher timeframe candles.
Users have full customization over moving average parameters, UI colors, dashboard positioning, and filter thresholds. This tool suits trend followers, price action traders, day traders, and scalpers seeking institutional-grade multi-timeframe market context in a streamlined interface.