الوصف
مؤشر VPD
VPD هو مؤشر يُنصح به لأولئك الذين يقومون بعمليات داخل اليوم، في أي رمز فوركس.
يتكون من مجموعة من بعض المعايير، وهي:
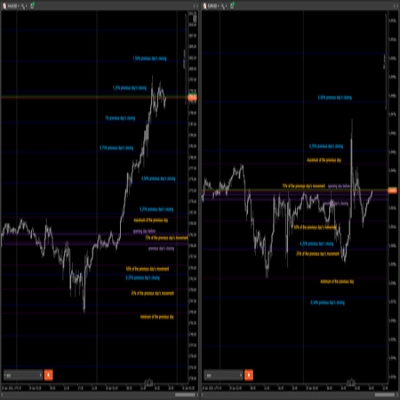
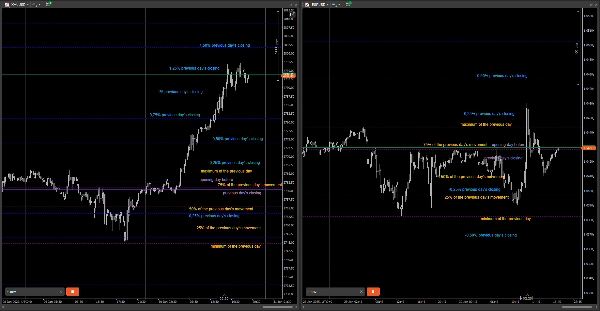
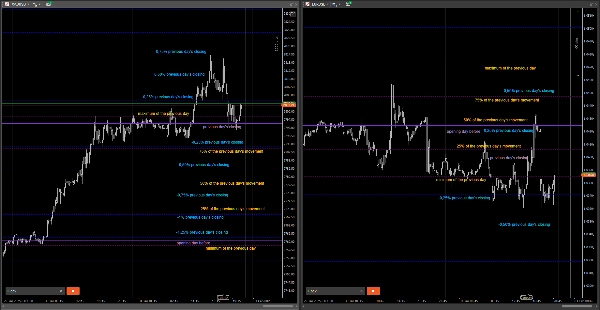
• افتتاح وإغلاق اليوم السابق؛
• الحد الأقصى والأدنى لليوم السابق مع تغييرات النسب الوسيطة 25٪، 50٪ و 75٪ (يمكن تكوينها) من كامل حركة اليوم السابق؛
• تغييرات السعر بالنسبة المئوية لإغلاق اليوم السابق من -2٪، -1.75٪، -1.50٪ ... +1.50٪، +1.75٪، +2٪ (يمكن تكوينها).
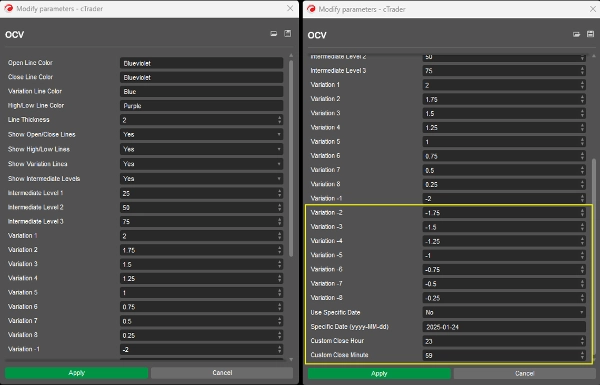
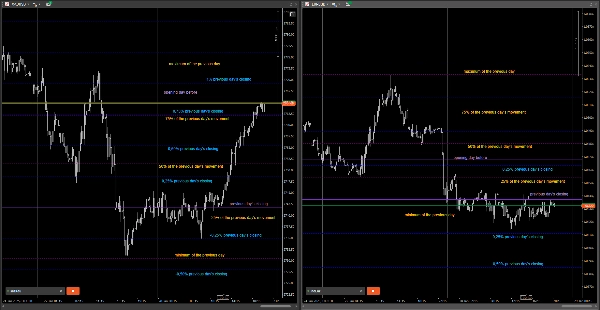
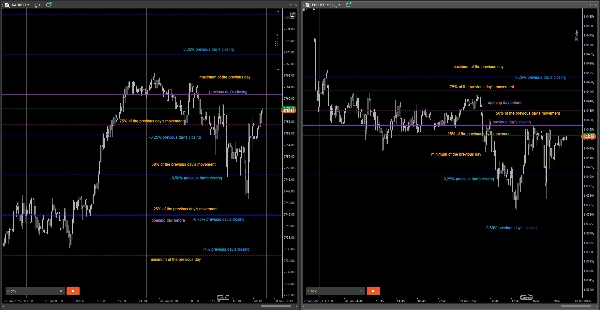
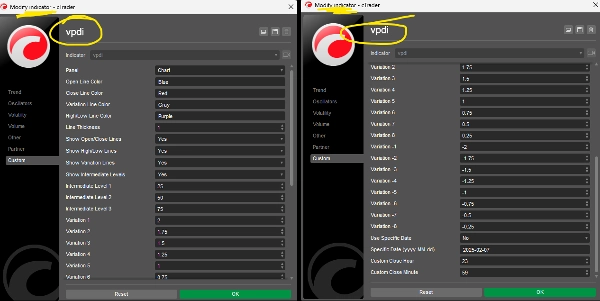
يمكنك اختيار تغيير الألوان، سمك الخطوط والنسب المئوية، وكذلك تحديد أي منها تريد عرضه على الرسم البياني، كما في الأمثلة أدناه.
إذا كنت تريد عرضه في فترة زمنية محددة، يمكنك إعلام التاريخ والوقت.
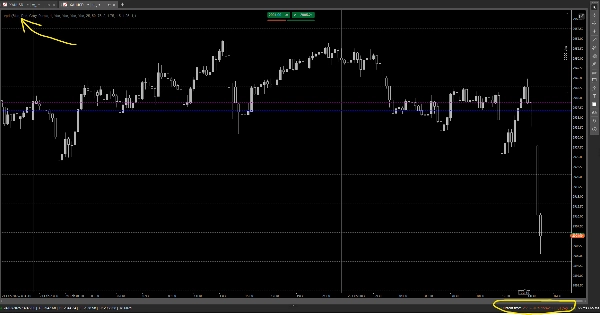
(في الطباعة يظهر كـ cbot، لكنني غيرته لاحقًا إلى مؤشر.)
قمت بتحديثه بلقطة شاشة (تُظهر المؤشر على الرسم البياني) بتاريخ اليوم (25/02/2025).
البريد الإلكتروني للتواصل: ortsac.nanido@gmail.com


![شعار "[Stellar Strategies] MARSI Signal Plotter"](https://cdn.ctrader.com/image/webp/7b2b8da6-8f8e-4646-8d4a-4710c516c01e_25567)


