VIX - volatility indicator - Renko
Gösterge
Sürüm 1.0, Feb 2025
Windows, Mac
Açıklama
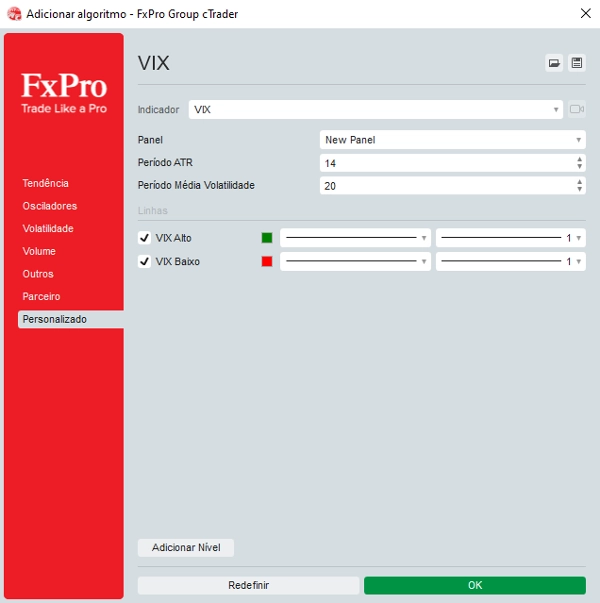
Parametreleri ayarlayın: LowLevel ve HighLevel seviyeleri için istenen değerleri girin ve VIX çizgisinin istenen yüksekliğe gelmesi için VIX Ölçek Faktörünü ayarlayın.
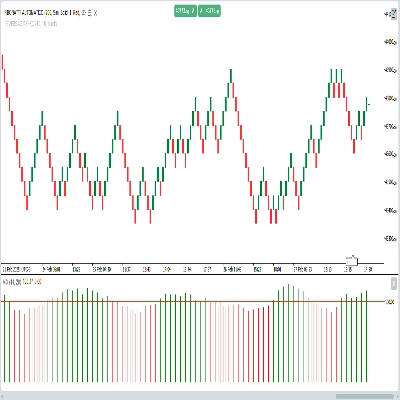
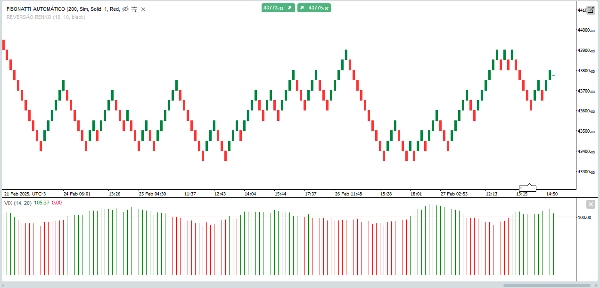
Grafiğe bakın:
VIX HighLevel seviyesini aştığında ve hacim yüksek olduğunda (yeşil mumlar), bir kırılma olduğunu düşünebilirsiniz.
VIX LowLevel seviyesinin altındaysa, düşük volatilite dönemini gösterebilir.
Özet
Gösterge profili
Müşteri değerlendirmeleri
0.0
Değerlendirmeler: 0
Müşteri değerlendirmeleri
Bu ürün için henüz bir değerlendirme yok. Ürünü denediniz mi? O zaman ona dair görüşlerini paylaşan ilk kişi olun!
Tartışma
SSS
Breakout
cTrader Store üzerinden erişilebilen işlem botları, göstergeler ve eklentiler gibi ürünler, üçüncü taraf sağlayıcılar tarafından sağlanır ve yalnızca bilgilendirme ve teknik erişim amaçlarıyla sunulur. cTrader Store bir broker değildir ve yatırım tavsiyesi, kişisel öneriler vermez veya gelecekteki performansı garanti etmez.


Fiyat
Başlangıç 05/02/2025
30
Satışlar