Description
Présentation de l'indicateur Moyenne Mobile améliorée, conçu pour une meilleure personnalisation et flexibilité dans votre analyse de trading.
Cette version améliorée prend également en charge les moyennes mobiles de périodes plus longues vers des unités de temps en ticks et Heikin Ashi. Les périodes Renko et Range ne sont pas encore prises en charge.
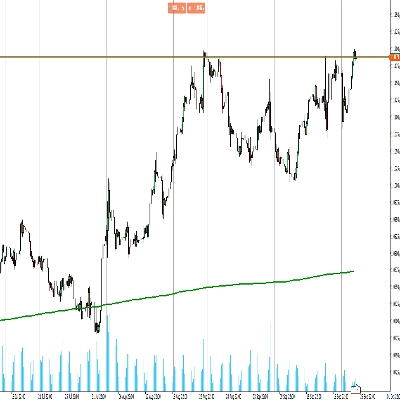
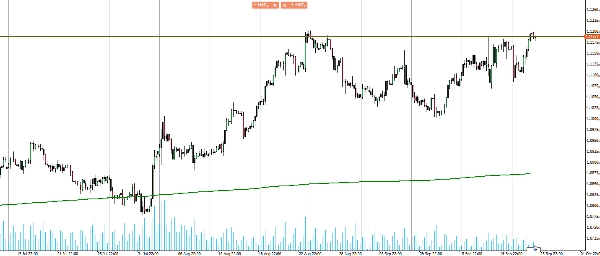
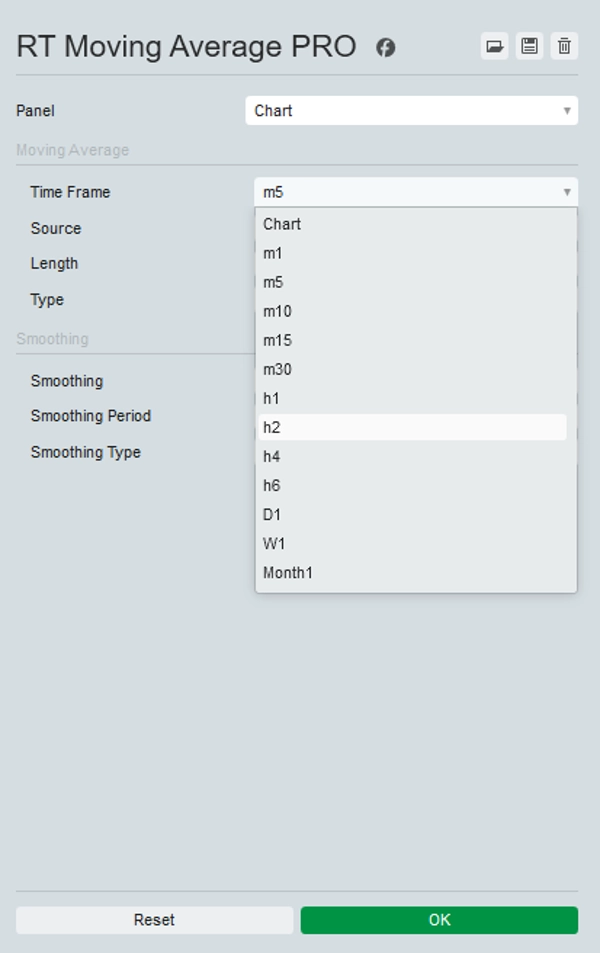
Cet indicateur vous permet de choisir n'importe quelle unité de temps, vous permettant d'afficher, par exemple, la MM 200 journalière sur n'importe quelle autre unité de temps.
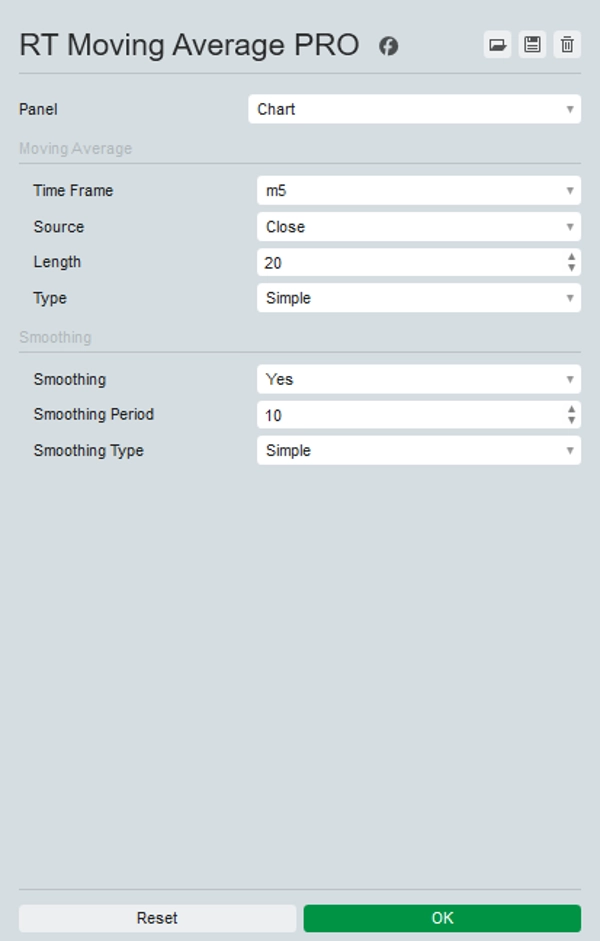
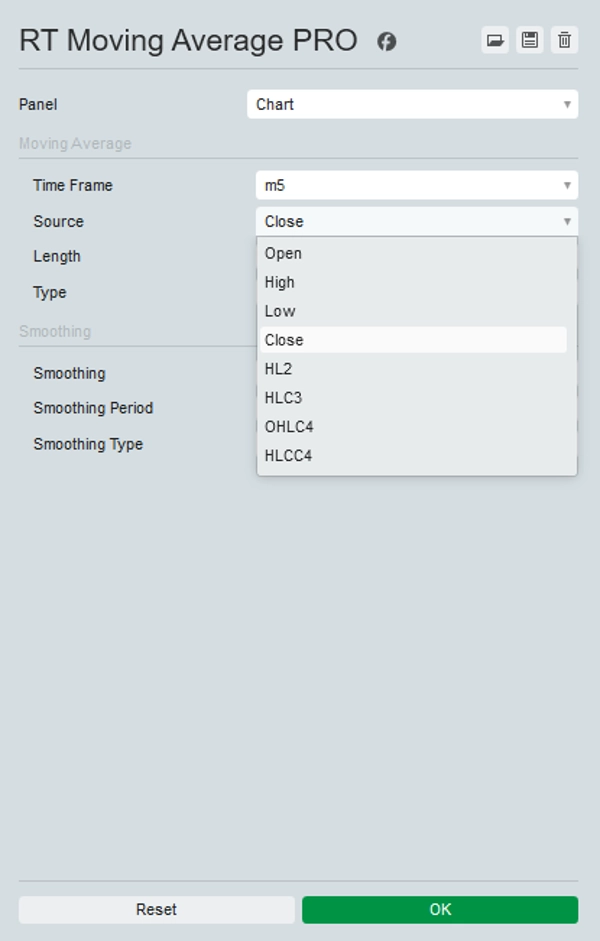
De plus, il offre une gamme de sources de prix à sélectionner, incluant Open, High, Low, Close, HL2, HLC3, OHLC4, et HLCC4, tout comme dans TradingView, ainsi qu'une option de lissage pour résoudre les problèmes d'échantillonnage sur les unités de temps inférieures.
En offrant ces options, vous pouvez adapter la Moyenne Mobile à votre stratégie de trading spécifique et obtenir des insights plus précis sur les tendances du marché.
Améliorez votre boîte à outils de trading avec l'indicateur Moyenne Mobile améliorée pour une analyse et une prise de décision supérieures.


