
🎯 大师交易指标 – 每个信号的精准度
释放专业级指标的力量,汇集技术分析中最有效的工具。专为追求决策清晰、准确和快速的严肃交易者设计。
🔍 主要特点:
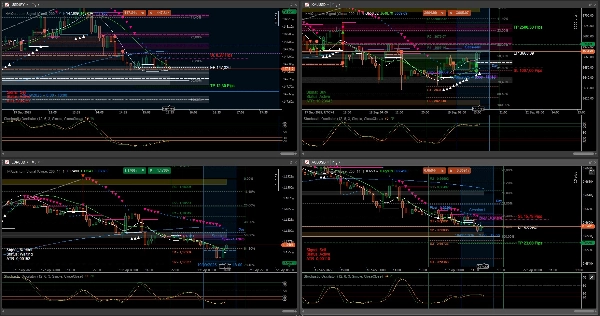
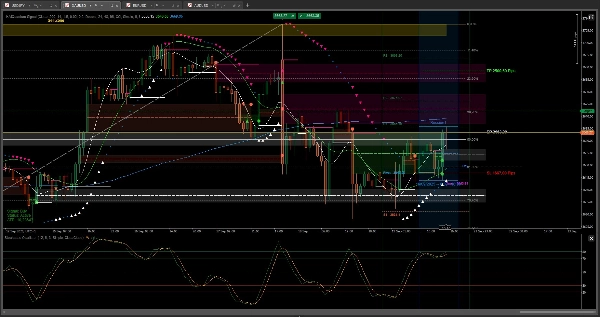
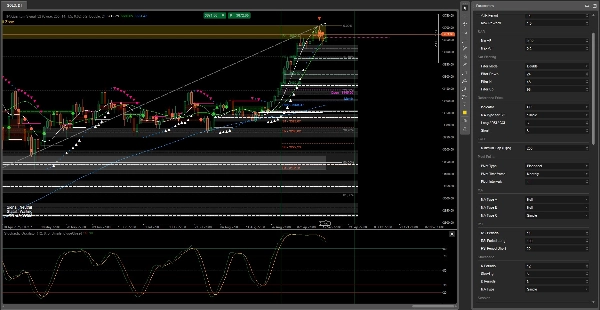
- 📈 三重动态移动平均线:平滑趋势检测与确认,实现最佳进出场时机。
- 🌀 集成抛物线SAR:高灵敏度定位潜在反转点。
- 📊 智能信号系统:基于 18 个技术参数生成买卖信号,评估实时市场状况。
- 📐 基于波动率的入场逻辑(ATR):信号条件动态适应资产波动性。
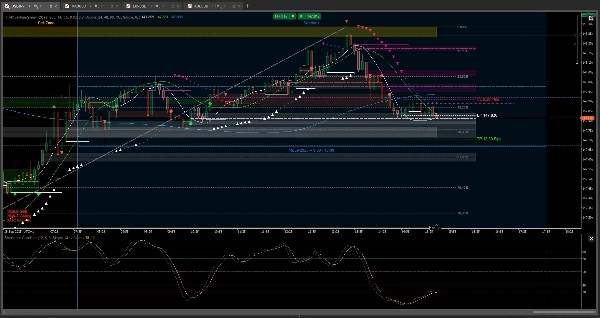
✅ 非常适合剥头皮、日内交易或高频分析。该指标不仅显示信号,还以坚实的技术逻辑支持信号。
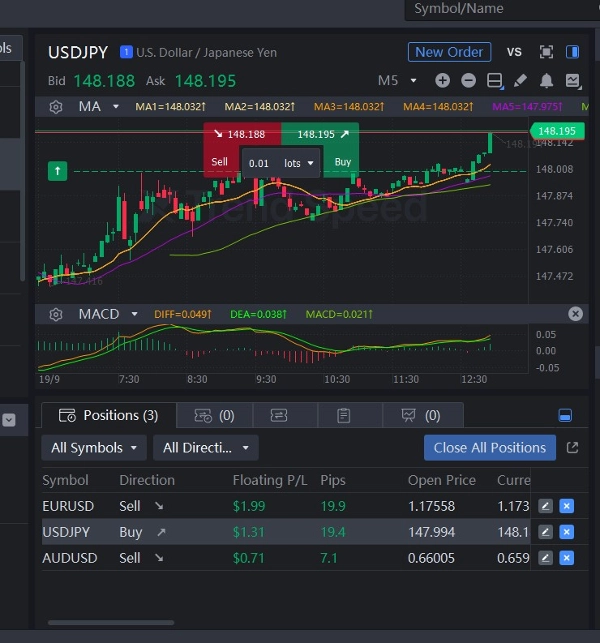
💡 兼容多种资产:外汇、指数、商品等。
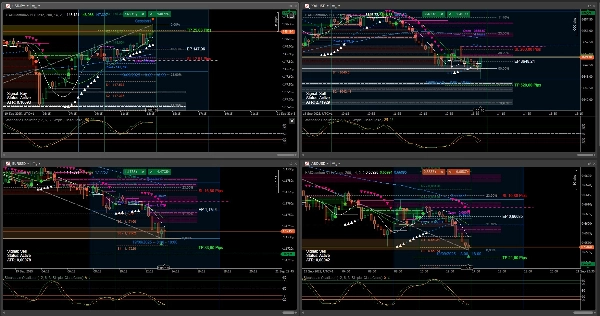
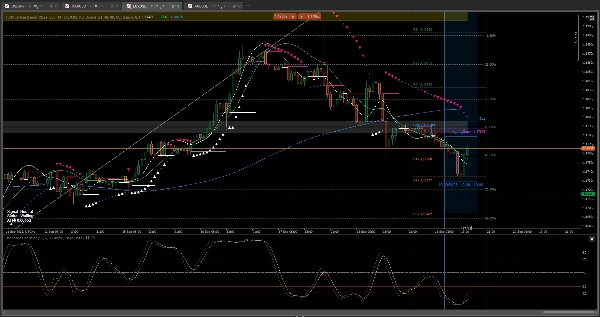
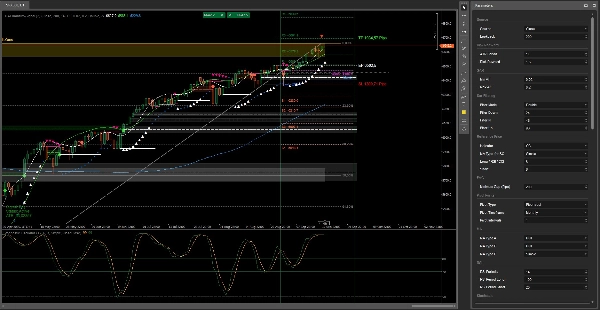
我们的系统 默认配置经过多资产和多时间框架的广泛测试,证明是实现卓越结果的最优选择。一旦信号触发,我们的算法会持续保持该信号,直到市场条件发生变化,确保 一致性,防止过早平仓。
有时价格可能会超过 “止盈”目标。这是因为系统使用了18个额外参数来优化退出,旨在最大化您的盈利能力。您拥有 完全控制权:系统生成信号,您可以做出最终决定,并结合自己的分析,如使用随机指标或RSI等技术指标。
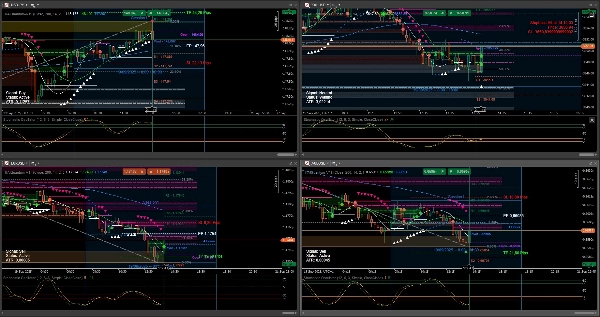
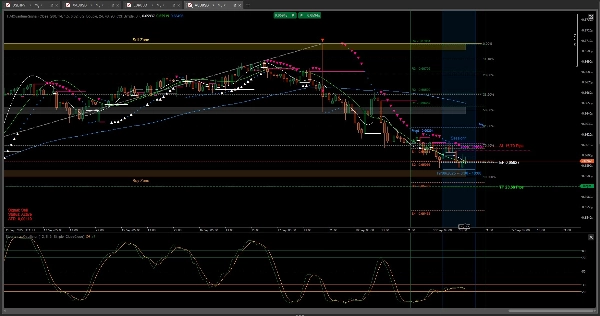
系统仅在所有 18 条件完全符合时生成信号。如果有任何一个条件未满足,信号将保持中立。这确保只显示最可靠的机会。不同时间框架的信号存在可能不同,因为算法会独立分析每个时间框架。
指标配置
0.0
评价:0
客户评价
该产品尚无评价。已经试过了?抢先告诉其他人!
BTCUSD
Forex
Signal
Indices
EURUSD
Commodities
GBPUSD
NZDUSD
RSI
Prop
Scalping
Supertrend
Crypto
Stocks
XAUUSD
NAS100
ATR
MACD
USDJPY
cTrader Store 提供的所有产品,包括交易机器人、指标和插件,均由第三方开发者提供,仅供信息参考和技术访问之用。cTrader Store 并非经纪商,不提供投资建议、个人推荐或任何未来业绩保证。
该作者的其他作品


!["[CB] Pivot Points Pro" 标识](https://cdn.ctrader.com/image/webp/43463c82-67b0-4f10-a4ba-901bba091d81_32594)


147
销售
11.16K
免费安装