
Penerangan
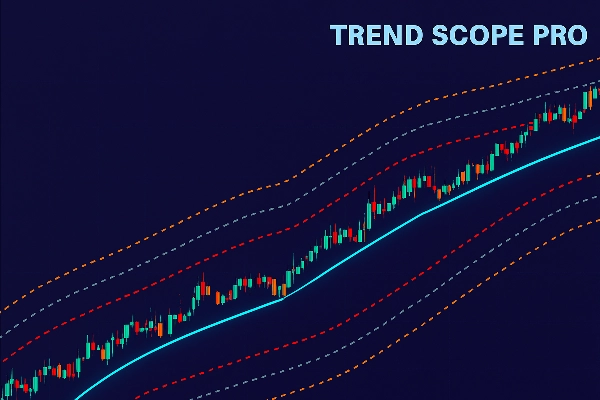
Trend Scope Pro adalah penunjuk teknikal tahap profesional yang direka untuk memberikan pedagang pemahaman yang lebih mendalam tentang struktur pasaran dan arah harga. Dibina berdasarkan algoritma regresi linear lanjutan, alat ini mengira garis regresi dinamik bersama dengan tiga tahap saluran sisihan piawai. Dengan menggabungkan ketepatan statistik dengan kejelasan visual, ia membantu anda mengenal pasti tren pasaran semasa, zon pembalikan potensi, dan julat volatiliti dengan mudah, menjadikannya tambahan yang mudah diakses tetapi berkuasa kepada mana-mana set alat perdagangan.
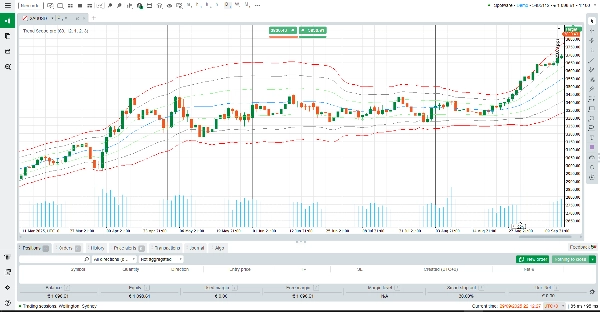
Cara Membaca Trend Scope Pro
Apabila digunakan pada carta anda, Trend Scope Pro melukis garis regresi tengah (biru), yang mewakili “nilai adil” atau arah tren purata sepanjang tempoh yang ditetapkan. Di sekitar garis ini, tiga set saluran atas dan bawah dilukis (jingga, kelabu, dan merah). Setiap saluran dikira menggunakan pengganda sisihan piawai yang berbeza:
Atas/Bawah 1 (Jingga): Mewakili sisihan piawai pertama. Pergerakan harga dalam zon ini sering mencerminkan volatiliti jangka pendek yang normal.
Atas/Bawah 2 (Kelabu): Menandakan penyimpangan yang lebih kuat. Mencapai zon ini sering menandakan pergerakan yang berpanjangan atau momentum yang sedang berkembang.
Atas/Bawah 3 (Merah): Zon ekstrem di mana pasaran mungkin terlebih beli atau terlebih jual, mewujudkan peluang pembalikan potensi.
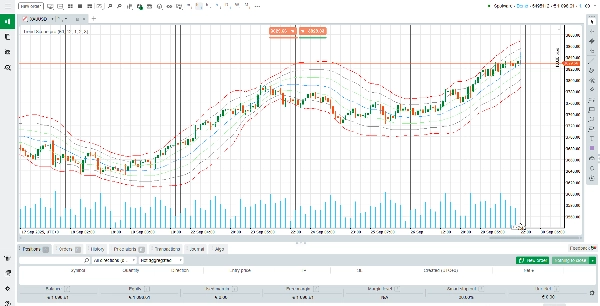
Dalam praktik, pedagang boleh menggunakan garis regresi untuk mengesahkan arah tren, sementara saluran bertindak sebagai tahap sokongan dan rintangan dinamik. Sebagai contoh:
Jika harga sentiasa berada di atas garis regresi, tren adalah menaik.
Jika harga berulang kali menguji atau menembusi di bawah garis regresi, tren semakin lemah.
Sentuhan ekstrem pada saluran merah mungkin menonjolkan titik keletihan, di mana pembalikan atau penarikan balik lebih mungkin berlaku.
Cara Penunjuk Berfungsi
Trend Scope Pro mengira garis regresi dengan menganalisis harga penutupan sepanjang tempoh tinjauan yang dipilih. Ia kemudian mengukur sisihan piawai harga dari garis ini, yang menentukan lebar setiap saluran. Pendekatan statistik ini memastikan penunjuk menyesuaikan diri dengan volatiliti masa nyata, menyediakan keseimbangan antara isyarat mengikuti tren dan pandangan pembalikan purata.
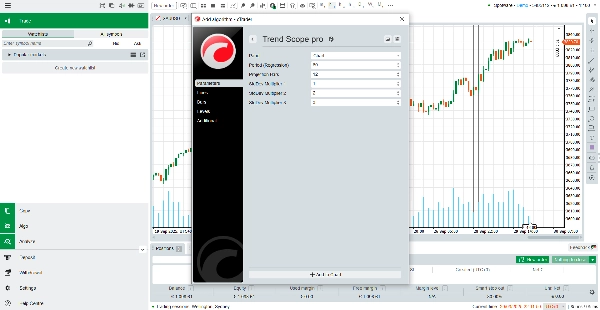
Tetapan lalai (60 bar tinjauan, pengganda 1.0, 2.0, 3.0) dioptimumkan untuk kebanyakan instrumen, tetapi anda boleh dengan mudah menyesuaikannya mengikut strategi atau jangka masa anda. Sama ada anda seorang pedagang harian yang mencari kemasukan intrahari, atau pedagang ayunan yang menganalisis kitaran pasaran yang lebih luas, Trend Scope Pro memberikan konteks yang boleh dipercayai untuk membuat keputusan.
Ciri Utama Trend Scope Pro
Regresi Linear Adaptif – Mengira tren pasaran tengah secara dinamik untuk bias arah yang tepat.
Saluran Berbilang Tahap – Tiga set jalur penyimpangan membantu mengenal pasti pergerakan normal, tren kuat, dan keadaan ekstrem.
Kejelasan Visual – Garis yang bersih dan berwarna memudahkan tafsiran tindakan harga dengan cepat.
Tetapan Boleh Disesuaikan – Tempoh tinjauan dan pengganda penyimpangan yang fleksibel untuk disesuaikan dengan gaya perdagangan apa pun.
Kesimpulannya, Trend Scope Pro menggabungkan kebolehpercayaan statistik dengan kegunaan praktikal. Ia lebih daripada sekadar garis tren—ia adalah rangka kerja lengkap untuk menganalisis tingkah laku harga, mengenal pasti zon berkemungkinan tinggi, dan memperbaiki masa perdagangan. Sama ada anda mencari pengesahan tren, menjangka pembalikan, atau sekadar menambah struktur pada carta anda, Trend Scope Pro menawarkan kejelasan dan keyakinan yang anda perlukan.
Ringkasan
Ulasan pelanggan
5 | 50 % | |
4 | 50 % | |
3 | 0 % | |
2 | 0 % | |
1 | 0 % |


