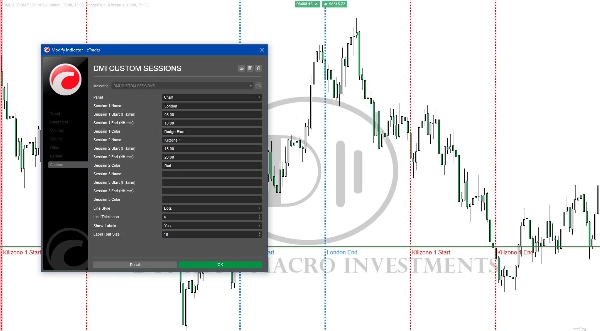
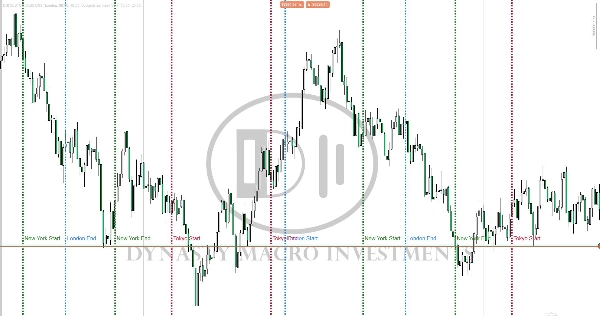
شعار "DMI CUSTOM SESSIONS"
DMI CUSTOM SESSIONS
صورة "DMI CUSTOM SESSIONS" المحملة
1
المبيعات

This will allow you to have SESSIONS on the chart. London, New York, Asian session and you can customize the times. You can give the session unique names and change the colors.

Indicator profile
0.0
التقييمات: 0
تقييمات العملاء
لا توجد تقييمات لهذا المنتج حتى الآن. هل جرَّبته بالفعل؟ كن أول من يخبر الآخرين!
Products available through cTrader Store, including trading bots, indicators and plugins, are provided by third-party developers and made available for informational and technical access purposes only. cTrader Store is not a broker and does not provide investment advice, personal recommendations or any guarantee of future performance.

المزيد من هذا المؤلف

Shows BUY & SELL signals for 3 & 4 BAR PATTERN (Morning star/ Evening star). It is adjustable and it will SHOW ARROWS.
Marks Monday's OPEN,HIGH & LOW. These are areas of support and resistance for the week.
Morning Star pattern on chart (Bullish and Bearish) automatically marked with (BUY & SELL) Very powerful signals.

قد يعجبك أيضًا

xhobaniFX_Anchored VWAP: Volume Weighted Average
Dynamic circles visualize price's volatility position. Like RSI for market overextension & stretch. Quantify context.
A multi-TF panel with candle timers, sessions, ticker, spread & 15+ themes. Fully customizable.
Visually map NASDAQ liquidity cycles on your chart using exact NY time. Includes a live countdown dashboard.
LudwigICT – Digital Root & IDR (cTrader Automate)
ECONEWS LIVE: Premium economic calendar for cTrader. Real-time, vertical event lines & news ticker.
شعار "Rsi + Volume"
5.0
(2)
مجاني
This indicator combines RSI (Relative Strength Index) with volume analysis to generate more reliable trading signals.
Candlestick pattern detector lite version
🚀 QQEX Trinity Indicator - The Ultimate Trading Filter 🚀
Plots automatic psychological levels at round-number zones – major structure & liquidity levels.
Advanced MA crossover indicator. All MA types supported. Clear signals with customizable arrows Perfect for all trader
شعار "Order Flow Ticks v2.0"
4.3
(21)
مجاني
Order Flow Ticks v2.0
The Parabolic SAR, or "Stop and Reverse," is a dynamic technical analysis tool.
Basic & FREE. Plots New York Initial Balance (NY local time) and projects IB High, IB Low, and midline.
A powerful overlay tool designed to automatically plot Fibonacci retracement levels based on a custom window.
TREND FALLOWING: Advanced technical indicator signal.
Enhance MACD Histogram! Visualize bull and bear price changes with vibrant colors for clearer, more insightful trading.
Swing-Trading Indicaotr for pairs like EUR/USD, AUD/USD, and USD/JPY. Most effective on higher time frames H4,H6,H12...
1
المبيعات