说明
矩阵趋势热图专业版
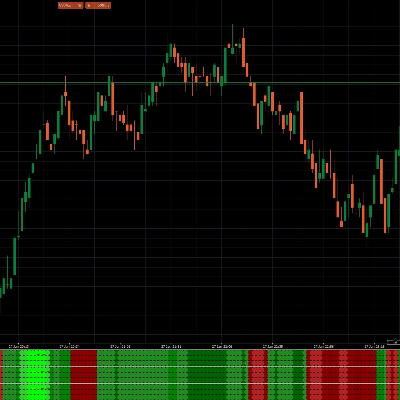
该指标是一个 多时间范围趋势与强度引擎,旨在一目了然地显示市场是 看涨(绿色)、看跌(红色)还是中性,以及该方向偏向的强度。
它不是依赖单一的“趋势线”,而是将 EMA结构 + 斜率方向 + 波动率(ATR) + 一致性融合成一个清晰的 综合强度得分。结果是在快速图表上能更平滑、更可靠地读取方向,避免震荡时的频繁反复。
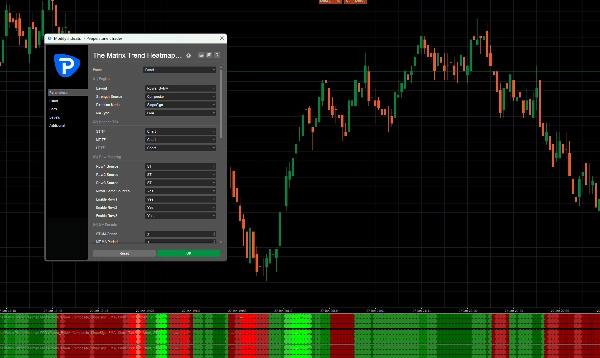
默认调校(Tick 30 / 1分钟)
默认设置是 专门针对Tick 30和1分钟图表调校的。这些数值不是随机的——它们作为一个完整的组合被校准,以平衡 速度 + 稳定性,使指标能快速响应真实趋势变化,同时过滤微小噪音。
默认亮点:
- 移动平均类型: EMA
- 方向模式: 斜率符号
- 短期/中期/长期时间框架: 图表(逻辑对齐,无时间框架不匹配)
- 短期/中期/长期移动平均周期: 3(响应快速,适合Tick30/1分钟)
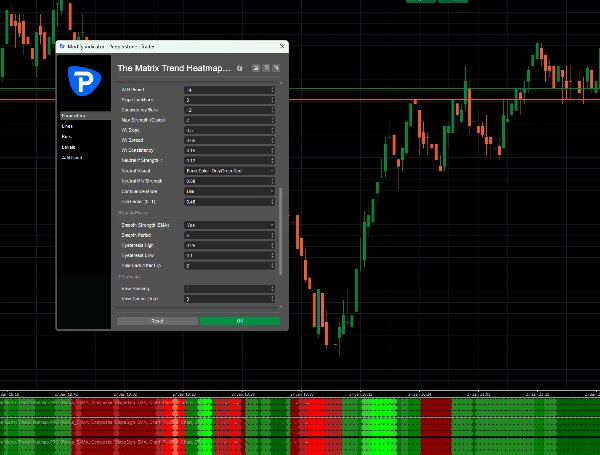
- ATR周期: 14(稳定的波动率归一化)
- 斜率回溯: 3(响应灵敏且不过度闪烁)
- 一致性条数: 12(过滤快速图表上的微震荡)
- 最大强度: 2(保持视觉清晰和可控)
综合权重(默认值):
中性阈值(默认):
- 当强度 < 0.12
当强度降至此水平以下时,指标有意将市场视为“无优势”,帮助您避免在震荡区间中过度交易。
指标功能
1) 方向(斜率符号)
方向由所选移动平均线(默认:EMA)的 斜率(角度) 决定。
- 正斜率 → 上升趋势(绿色)
- 负斜率 → 下降趋势(红色)
2) 综合强度(不仅是“趋势开/关”)
颜色和强度代表 趋势强度,不仅仅是方向。强势趋势显得更果断和稳定;弱势趋势则趋向中性。
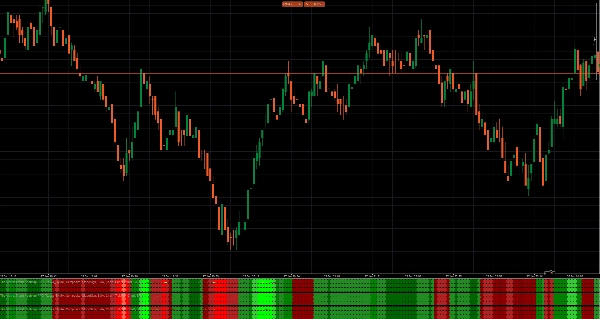
3) 多时间范围框架(短期/中期/长期)
该指标支持多个“时间范围”(短期/中期/长期)。在默认调校中,这些映射到 图表时间框架,以保持Tick 30 / 1分钟上的行为一致且可预测。
为什么它有用(真实交易价值)
大多数趋势指标失败的原因有两种:
- 它们 太慢(确认迟缓),或者
- 它们 太嘈杂(横盘市场中频繁反复)。
该引擎通过结合以下因素解决了这一问题:
- 斜率(方向 + 动量)
- 价差(运动压力/空间)
- 一致性(趋势持续的清晰度)
全部使用 ATR 归一化,因此行为在不同波动率环境下更稳定——这在快速图表上尤为重要。
如何使用(简单有效)
趋势过滤器(主要用途)
- 当引擎保持绿色时,只寻找 多头设置。
- 当引擎保持红色时,只寻找 空头设置。
- 在 中性状态时,要么等待——要么仅在额外确认和更紧目标下交易。
入场时机
使用您自己的触发条件(回调、突破、形态等),但让指标定义 方向性背景和强度。
避免震荡
频繁的中性/弱势阶段 = 区间/无优势。
这就是指标告诉你:保护资金,减少仓位,或等待结构形成。
安全调整(不破坏调校)
如果你想让它 更平稳(不那么敏感):
- 将 斜率回溯从3增加到4/5
- 将 一致性条数从12增加到14/16
如果你想让它 更快:
提示:一次只更改 一个参数。默认值是作为一个平衡系统调校的。
一句话总结
一个 快速、ATR归一化的EMA斜率趋势引擎,带有 综合强度得分(斜率 + 价差 + 一致性),默认调校适用于Tick 30和1分钟图表,旨在减少噪音并突出高优势的趋势条件。


!["Gaussian Channel [Iridio Capital]" 标识](https://cdn.ctrader.com/image/webp/7c039209-5573-4a54-a072-f9528b503103_41960)


