

Descripción
LA IDEA
Un Canal Donchian que añade contexto de rango de un marco temporal superior en lugar de ver cada ruptura de forma aislada.
EL PROBLEMA
Un Canal Donchian estándar te indica cuándo el precio alcanza un extremo reciente.
Pero una ruptura no ocurre de forma aislada.
Una ruptura en M15 puede ser significativa — o simplemente puede ser el precio moviéndose dentro de un rango mucho mayor Diario o Semanal.
Por lo tanto, la misma ruptura puede tener un contexto muy diferente dependiendo de dónde ocurra dentro del rango de marco temporal superior.
El canal muestra la ruptura. Pero el canal solo no muestra dónde se sitúa esa ruptura dentro del rango mayor.
EL CONCEPTO CENTRAL: EL CANAL MUESTRA EL MOVIMIENTO. EL MARCO TEMPORAL SUPERIOR MUESTRA DÓNDE SUCEDE.
Una ruptura no es solo un evento.
También tiene una ubicación.
Dos rupturas pueden parecer idénticas en el marco temporal de ejecución mientras ocurren en posiciones muy diferentes dentro del rango de marco temporal superior.
Una puede ocurrir cerca del centro del rango mayor.
Otra puede ocurrir directamente dentro de su límite superior.
La acción del precio puede parecer igual.
El contexto no lo es.
Este indicador hace visible ese contexto al colocar el rango completado previo de marco temporal superior directamente en tu gráfico actual.
En lugar de preguntar solo:
"¿El precio rompió el canal?"
también puedes preguntar:
"¿Dónde ocurrió la ruptura?"
QUÉ HACE
Donchian Channel con Contexto de Marco Temporal combina dos capas de información en un solo gráfico:
1. Donchian del Marco Temporal Actual
El Canal Donchian estándar rastrea el máximo, mínimo y punto medio recientes del mercado actual.
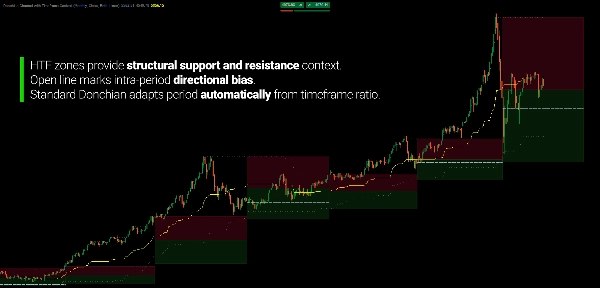
Su período se calcula automáticamente a partir de la relación entre el marco temporal de tu gráfico y el marco temporal de contexto seleccionado. Por ejemplo, un contexto Semanal en un gráfico H1 produce una mirada hacia atrás de 120 barras.
No necesitas decidir si el canal debe usar 20, 50 o 100 barras.
La relación de marcos temporales define la mirada hacia atrás.
2. Contexto de Marco Temporal Superior
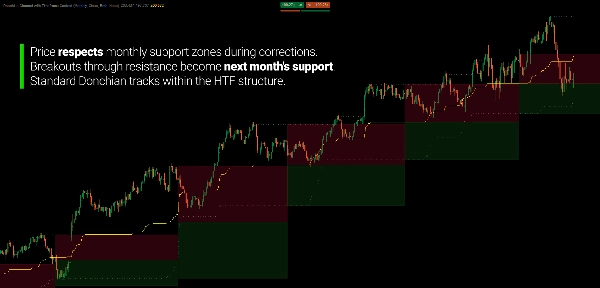
El rango del período completado previo de marco temporal superior se proyecta hacia adelante en tu gráfico actual como zonas de soporte y resistencia.
Su rango se divide en dos áreas:
Zona de Soporte
Desde el mínimo del período previo hasta su punto medio.
Zona de Resistencia
Desde el punto medio hasta el máximo del período previo.
A medida que el precio se desarrolla en tu marco temporal actual, puedes ver inmediatamente su posición dentro de ese rango mayor.
DOS MARCOS TEMPORALES. UN GRÁFICO.
El Donchian del marco temporal actual muestra el movimiento que se desarrolla alrededor de los extremos recientes.
El rango de marco temporal superior proporciona el marco de referencia mayor.
Por ejemplo:
Contexto Semanal → gráfico H1
o
Contexto Diario → gráfico M5
El marco temporal inferior sigue siendo el movimiento activo.
El marco temporal superior simplemente proporciona el rango circundante.
El canal muestra lo que el precio está haciendo. El marco temporal superior muestra dónde sucede.
EL MARCO TEMPORAL SUPERIOR NO ANULA AL INFERIOR
El rango de marco temporal superior no es una señal que te diga qué debe hacer el precio.
Es un marco de referencia.
Una ruptura en un marco temporal inferior puede continuar a través de la resistencia del marco temporal superior.
Un retroceso puede detenerse dentro del soporte del marco temporal superior.
El precio también puede moverse completamente más allá del rango previo y entrar en territorio nuevo.
El propósito no es predecir qué resultado ocurrirá.
Es hacer visible el rango mayor mientras observas el desarrollo del movimiento menor.
DEJA QUE EL CONTEXTO SE ACTUALICE SOLO
Las zonas de marco temporal superior se basan en el período completado previo.
Cuando comienza un nuevo período de marco temporal superior, el rango de contexto se actualiza.
Por ejemplo:
Semana Anterior → Semana Actual
El máximo, mínimo y punto medio de la semana anterior se convierten en la referencia para la semana actual.
En un gráfico H1, esos límites permanecen visibles mientras el Canal Donchian del período actual sigue desarrollándose.
Por lo tanto, obtienes una referencia persistente sin tener que dibujar manualmente el rango del período previo.
EL CONTEXTO DEL MARCO TEMPORAL ES TU ELECCIÓN
Elige el marco temporal superior que proporcione el contexto que deseas:
- Mensual
- Semanal
- Diario
- 4 Horas
- 1 Hora
- 30 Minutos
- 15 Minutos
- Y otras combinaciones soportadas
El indicador maneja automáticamente el período Donchian correspondiente.
Tú eliges el contexto. El cálculo se adapta a él.
REFERENCIA OPCIONAL DEL PRECIO DE APERTURA
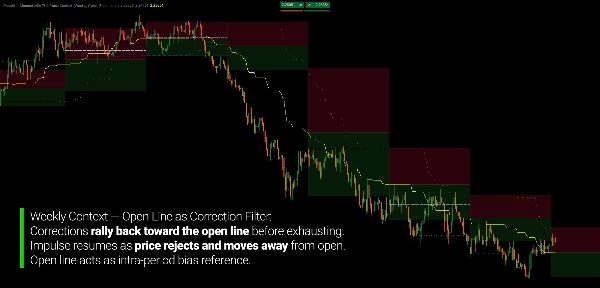
También se puede mostrar el precio de apertura del período actual de marco temporal superior.
Esto te da otra referencia de dónde se está negociando el precio en relación con el precio de apertura del período actual de marco temporal superior.
Actívalo cuando quieras contexto adicional.
Ocúltalo cuando quieras que el gráfico se enfoque en las dos capas Donchian.
ELIGE CÓMO SE CALCULA EL CANAL
Los límites Donchian pueden calcularse a partir de:
Cierre
o
Máximo / Mínimo
El cálculo basado en cierre produce límites a partir de precios de cierre.
El cálculo Máximo/Mínimo incluye los extremos completos de las mechas y por lo tanto representa un rango de precio más amplio.
La misma selección de fuente se aplica de manera consistente tanto a los cálculos del marco temporal actual como al superior.
DISEÑADO PARA CONTEXTO, NO PARA PERSEGUIR SEÑALES
Donchian Channel con Contexto de Marco Temporal no es un sistema de predicción de rupturas.
No te dice si una ruptura tendrá éxito.
Te da un entorno definido en el cual observarla.
Úsalo para estudiar:
- Rupturas
- Retrocesos
- Límites de marcos temporales superiores
- Posición dentro de un rango mayor
- Expansión más allá de extremos previos
- Geometría de precios multi-marco temporal
- Movimiento actual relativo al período previo
El Donchian estándar te dice dónde están los extremos actuales.
El contexto de marco temporal superior te dice dónde se sitúan esos extremos dentro del rango mayor.
CARACTERÍSTICAS CLAVE
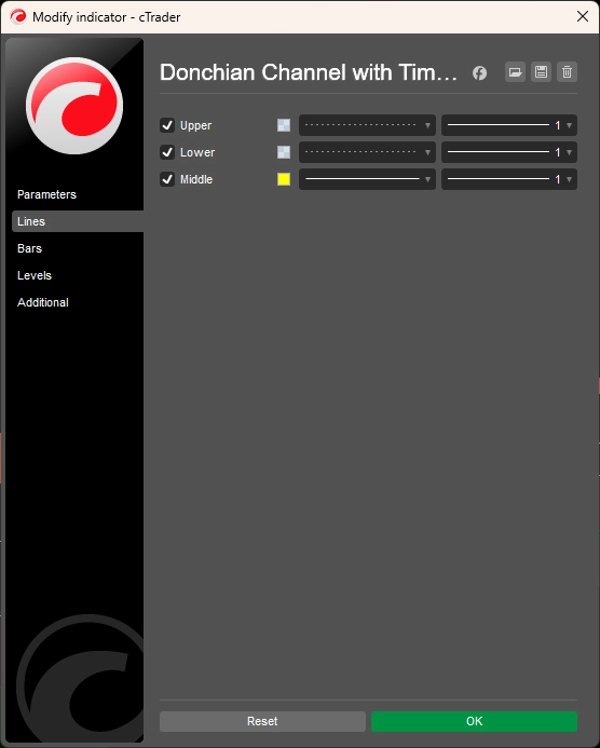
- Canal Donchian estándar
- Cálculo automático del período del marco temporal actual
- Proyección del rango de marco temporal superior
- Zonas de contexto de soporte y resistencia
- Máximo, mínimo y punto medio del período previo
- 13 contextos de marco temporal seleccionables, desde Mensual hasta Minuto 15
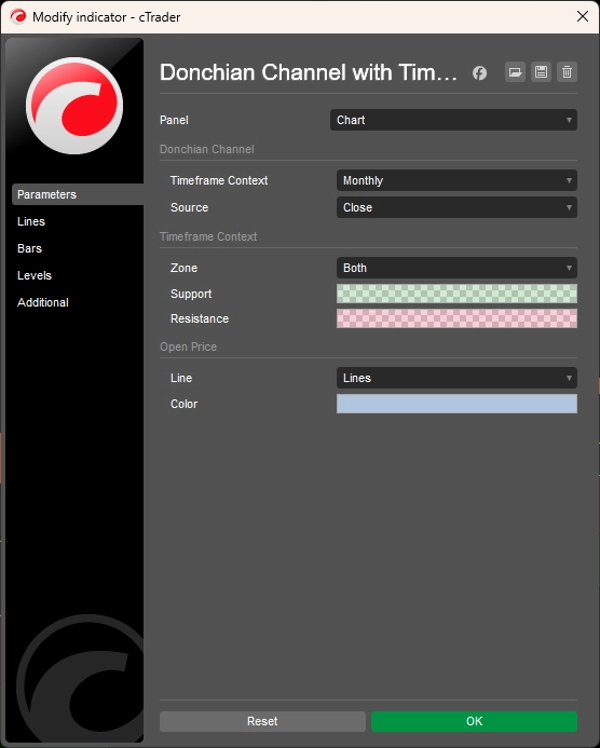
- Precio de apertura opcional de marco temporal superior
- Modos de cálculo Cierre o Máximo/Mínimo
- Visualización configurable de zonas: Ambas, solo Soporte, solo Resistencia o Ninguna
- Opciones de visualización solo Soporte / solo Resistencia
- Actualizaciones en tiempo real
- Soporte para gráficos basados en tiempo y no basados en tiempo, incluyendo Tick, Renko y Rango
---
El trading implica riesgo. Este indicador es una herramienta de análisis técnico y debe usarse junto con una gestión de riesgo adecuada.
Resumen
This dual-layer system automatically adapts the Donchian lookback period based on the ratio between the selected higher timeframe and the chart timeframe, eliminating manual period settings. It supports 13 timeframe options from Monthly to 15 Minutes and can be applied across various markets including forex pairs (EURUSD, GBPUSD, USDJPY, NZDUSD), commodities (XAUUSD), indices (NAS100), and cryptocurrencies (BTCUSD).
Key features include real-time updates of both standard and higher-timeframe channels, configurable visual zones with adjustable colors and transparency, an optional open price line marking the higher-timeframe period’s open, and flexible price source settings (close or high/low).
The indicator aids traders in filtering false breakouts by showing whether price movements occur within structural supply or demand zones on a higher timeframe. It is designed for trend-following, swing, and discretionary traders who use Donchian channels and seek enhanced structural context to better assess breakout significance and correction exhaustion without switching timeframes.
Valoraciones de clientes
Conversación
Preguntas frecuentes























Precio