说明
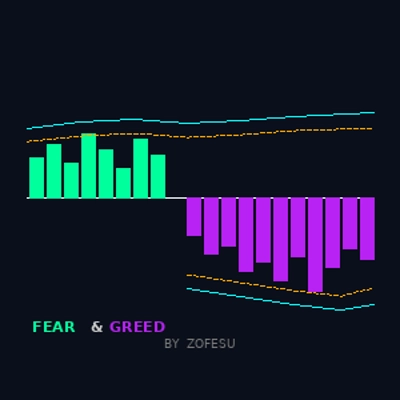
📊 Zofesu的恐惧与贪婪 — 双重VIX引擎 | 机构情绪检测
恐惧与贪婪是基于双重Williams VIX Fix引擎构建的精密振荡器——一个针对恐慌(恐惧)校准,一个针对狂热(贪婪)校准。它识别机构过热达到统计极端水平的时刻,发出高概率反转区信号。
⚙ 工作原理
该指标运行两个独立的WVF计算:
恐惧引擎 — 测量当前最低价距离最近最高收盘价的距离。峰值信号表示投降和恐慌。
贪婪引擎 — 测量当前最高价距离最近最低价的距离。峰值信号表示狂热的过度延伸。
每个引擎通过两个独立阈值进行过滤:
1. 布林带上/下边界(2×标准差)
2. 百分位排名阈值(可配置)
只有当价格同时或任一阈值被突破时,柱状图才会出现——消除噪音,仅显示统计学上显著的极端值。
🔑主要特点
✅ 双重WVF引擎——恐惧(青柠色)和贪婪(紫色)独立计算,使用不同的回溯窗口
✅ 布林带——为每个引擎动态设置布林带边界
✅ 百分位线——可配置的百分位排名阈值
✅ 干净的柱状图输出——仅在极端读数时显示柱状图
✅ 所有4条边界线可独立开关
✅ 完全可配置——恐惧和贪婪的回溯和百分位可分开设置
✅ 适用于所有资产和时间框架
✅ 轻量级C#实现——无性能影响
📚使用方法
1. 将指标添加到任何图表作为独立面板
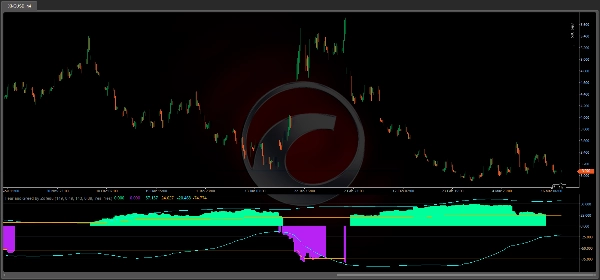
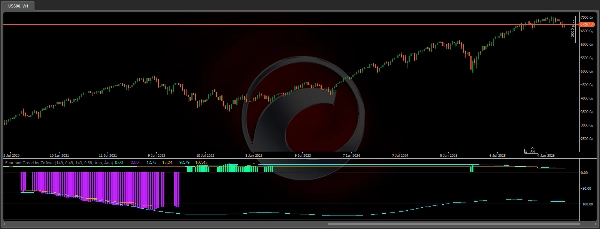
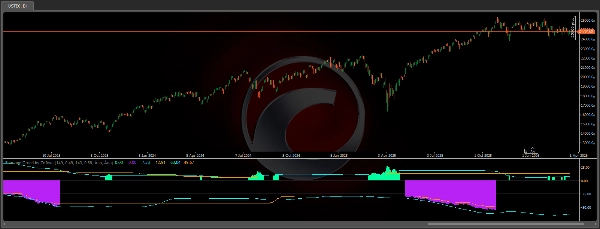
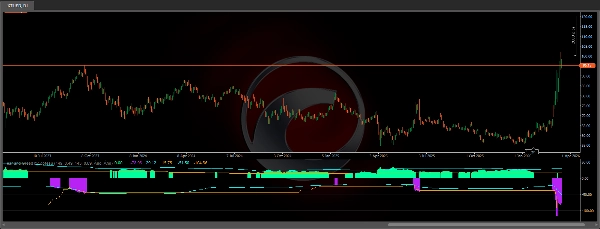
2. 青柠色柱状图 = 恐惧峰值——潜在的看涨反转区
3. 紫色柱状图 = 贪婪峰值——潜在的看跌反转区
4. 水绿色线条 = 每个引擎的布林带边界
5. 橙色虚线 = 百分位阈值
6. 与价格行为、支撑/阻力位、超级趋势或VWAP结合使用
7. 较高时间框架(D1,W1)产生最可靠信号。最佳结果见于:H1,H4,D1。适用资产:指数(NAS100,SPX500)、加密货币(BTCUSD)、外汇、黄金、石油、股票。
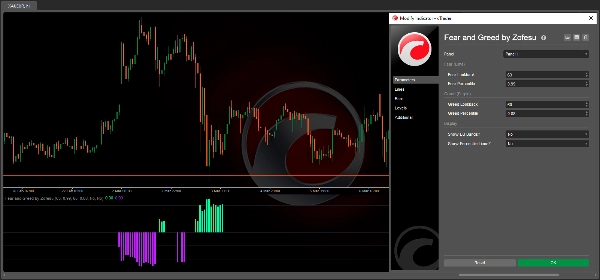
🔗参数
恐惧(青柠色):
- 恐惧回溯——用于WVF和布林带计算的柱数(默认149)
- 恐惧百分位——百分位排名阈值(默认0.49)
贪婪(紫色):
- 贪婪回溯——用于WVF和布林带计算的柱数(默认143)
- 贪婪百分位——百分位排名阈值(默认0.89)
显示:
- 显示布林带——开关水绿色边界线
- 显示百分位线——开关橙色阈值线
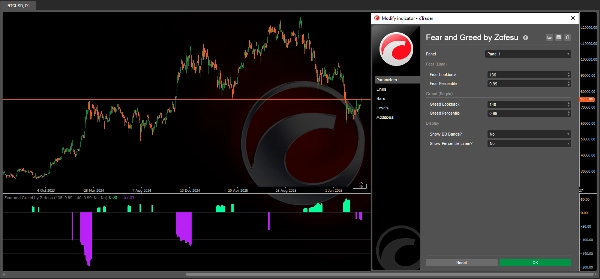
🎯 校准指南(基于经验)
每个资产和时间框架都需要其独特的设置——该指标设计允许这种灵活性。
步骤1 — 找到合适的回溯期:
首先将百分位设置为0.99,然后在10到1000之间尝试回溯值。
较高的回溯期减少噪音,但也可能隐藏有效信号。大多数设置推荐范围为50–500。
步骤2 — 微调百分位:
找到合适的回溯期后,逐渐将百分位从0.99向下调节。这会放宽过滤条件,显示更多信号。恐惧和贪婪参数不必相同。
步骤3 — 信号解读:
- 恐惧柱在收盘蜡烛上消失 → 下一根蜡烛可能做多入场。
- 贪婪柱在收盘蜡烛上消失 → 下一根蜡烛可能做空入场。
- 恐惧或贪婪持续点亮多根柱 = 市场处于趋势或仓位积累阶段——不一定是反转。
- 恐惧和贪婪同时点亮 = 压力冲突。先检查更高时间框架。附近有关键支撑/阻力位吗?如果有,等待确认后再入场。
信号数量完全取决于您和您的策略——更严格的设置产生更少但质量更高的入场信号。设置正确后,您可以在设置中关闭线条,以免干扰。
⚠️ 免责声明 交易金融工具存在重大亏损风险。任何指标或策略的过去表现不保证未来结果。此工具仅供信息和教育用途。请始终使用适当的风险管理,切勿冒超出承受能力的风险。作者不对因使用此指标而产生的任何交易损失负责。
摘要
客户评价
5 | 0 % | |
4 | 100 % | |
3 | 0 % | |
2 | 0 % | |
1 | 0 % |


!["[Stellar Strategies] MARSI Signal Plotter" 标识](https://cdn.ctrader.com/image/webp/7b2b8da6-8f8e-4646-8d4a-4710c516c01e_25567)


