
说明
Wyckoff示意指标是一款专业级的市场结构工具,旨在自动检测并在图表上可视化Wyckoff的积累和分配阶段。
基于Wyckoff方法的原理,该指标识别关键的机构事件,如销售高潮(SC)、自动反弹(AR)、弹簧、力量信号(SOS)、买入高潮(BC)、假突破(UTAD)等,帮助交易者实时理解聪明资金的行为。
与传统指标不同,该工具不依赖滞后信号,而是专注于价格结构、成交量行为和波动性,提供对市场动态的更深入洞察。
核心概念
该指标基于市场通过结构化周期运动的理念:
- 积累 → 涨价 → 分配 → 跌价
它自动检测并可视化:
- 市场区间
- Wyckoff阶段(A–E)
- 关键机构事件
- 结构性突破和假突破
主要特征
1. 自动Wyckoff阶段检测
该指标识别Wyckoff周期的所有主要阶段:
- 阶段A – 停止趋势
- 阶段B – 建立原因(区间形成)
- 阶段C – 弹簧 / UTAD(假突破)
- 阶段D – 趋势确认(SOS / SOW)
- 阶段E – 趋势延续
每个阶段都用可自定义颜色进行视觉高亮,便于即时识别。
2. 智能事件识别
系统检测关键的Wyckoff事件:
积累阶段:
- SC – 销售高潮
- AR – 自动反弹
- ST – 次级测试
- 弹簧 – 假跌破
- SOS – 力量信号
- LPS – 最后支撑点
分配阶段:
- BC – 买入高潮
- AR – 自动反应
- ST – 次级测试
- UTAD – 分配后的假突破
- SOW – 弱势信号
- LPSY – 最后供应点
这些事件直接在图表上以标签形式绘制。
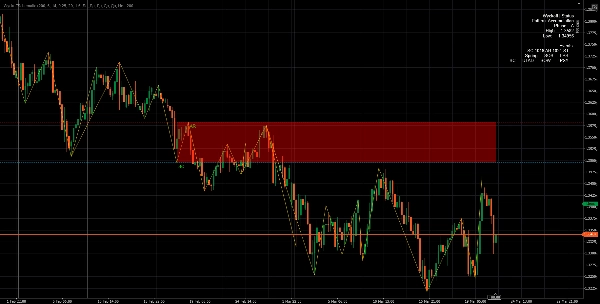
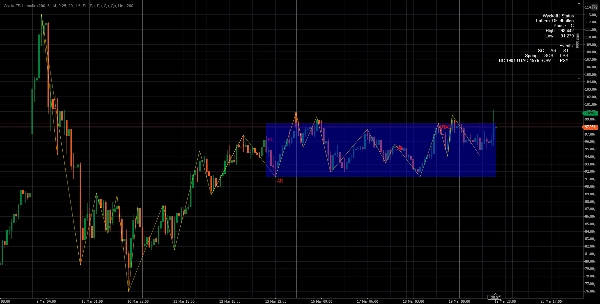
3. 自适应区间检测
该指标动态构建并更新交易区间:
- 自动检测区间高点和低点
- 使用基于ATR的容差调整边界
- 显示支撑和阻力区域
这使交易者能够清晰地看到市场的积累或分配位置。
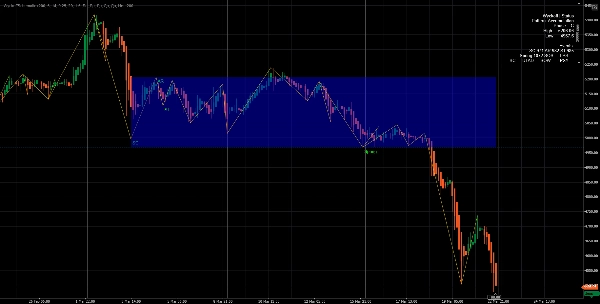
4. ZigZag结构引擎
内置的基于枢轴点的ZigZag系统:
- 过滤市场噪音
- 突出真实的结构高点和低点
- 确保准确的模式识别
这是可靠识别Wyckoff结构的关键。
5. 成交量与波动性整合
该指标使用:
- 成交量移动平均
- 成交量峰值检测
- ATR(平均真实范围)
这使其能够:
- 确认机构活动
- 过滤假信号
- 提高SC、BC、弹簧、UTAD等事件的准确性
6. 实时状态机逻辑
该指标核心运行一个状态机算法,它:
- 跟踪市场结构演变
- 阶段间转换(A → E)
- 防止重复信号
- 保持上下文(积累与分配)
7. 视觉组件
该指标提供完整的视觉工具包:
- ✔ 阶段高亮框
- ✔ 区间高低线
- ✔ ZigZag结构线
- ✔ 图表上的事件标签
- ✔ 实时状态面板
8. 状态面板(实时市场洞察)
内置面板显示:
- 当前模式(积累/分配)
- 当前阶段(A–E)
- 区间边界
- 检测到的事件
这为交易者提供了市场状况的即时概览。
9. 警报系统
可选的弹出警报在关键事件发生时通知您:
- SC、BC、弹簧、UTAD、SOS、SOW等。
非常适合监控多个市场。
优势
✔ 聪明资金视角
不同于常见指标,该工具遵循机构逻辑,而非零售指标。
✔ 早期信号检测
识别突破前的积累/分配,允许:
- 提前入场
- 更好的风险/回报设置
✔ 降噪
通过枢轴点、ATR和成交量过滤器,指标避免:
- 随机信号
- 市场噪音
- 假突破
✔ 完全自动化的Wyckoff分析
无需手动标记:
- 阶段
- 事件
- 区间
所有内容均自动检测。
✔ 高度可定制
您可以调整:
- 回溯周期
- 枢轴点灵敏度
- ATR容差
- 成交量灵敏度
- 视觉元素(标签、框、线)
✔ 性能优化
- 使用滑动窗口分析
- 限制绘图对象
- 适合实时交易
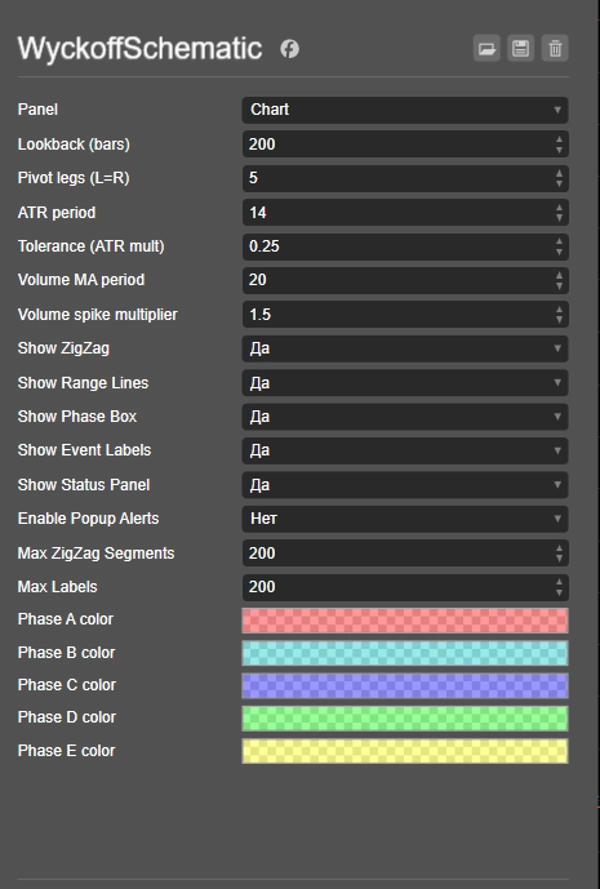
输入参数
结构与灵敏度
- 回溯柱数 – 分析范围
- 枢轴腿数 – 摆动检测灵敏度
波动性与容差
- ATR周期
- ATR乘数(容差)
成交量分析
- 成交量MA周期
- 成交量峰值乘数
可视化
- 显示ZigZag
- 显示区间线
- 显示阶段框
- 显示事件标签
- 显示状态面板
警报
- 启用弹出通知
工作原理(简化)
- 检测枢轴高点/低点(市场结构)
- 确定趋势背景(上涨/下跌)
- 寻找成交量峰值+结构条件
- 初始化Wyckoff模式(积累/分配)
- 逐步跟踪事件和阶段
- 实时更新图表视觉效果
最佳使用场景
- 聪明资金/Wyckoff交易
- 突破交易
- 区间交易
- 反转检测
- 机构订单流分析
结论
Wyckoff示意指标是一款强大的分析工具,将复杂的Wyckoff理论转化为完全自动化、可视化且可操作的交易系统。
它使交易者能够:
- 理解市场意图
- 识别高概率交易设置
- 与机构行为保持一致进行交易
摘要
客户评价
5 | 100 % | |
4 | 0 % | |
3 | 0 % | |
2 | 0 % | |
1 | 0 % |


