
RollingCorrelation
指标
60 下载
版本 1.0, Mar 2026
Windows 版、Mac 版
注册日期 16/01/2025
3.15M
交易量
2.04K
盈利点数
398
免费安装
说明
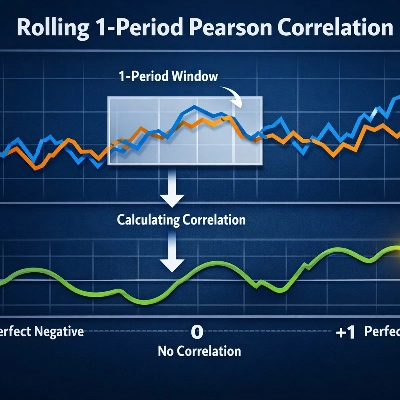
RollingCorrelation 计算每个收盘价与其 1 根柱滞后值之间在可配置窗口内的滚动 Pearson 相关系数。该指标返回范围在 [-1, 1] 之间的值,其中接近 +1 的值表示强正自相关(趋势延续),接近 -1 的值表示强负自相关(振荡或反转行为),接近 0 的值表示几乎没有线性自相关。
工作原理 对每根柱,它计算收盘价序列与同一序列向后移动一根柱后的 Pearson 相关系数,计算范围为指定的 Period 窗口(默认 20)。实现采用标准的协方差/方差公式,生成每根柱的单一相关值。
输入
- Period(整数,默认 20):滚动窗口中的柱数。该指标至少需要 Period+1 根柱来计算第一个值。
输出
- Correlation(线):每根柱的滚动相关值,范围 [-1, 1]。
解释与实际应用
- 接近 +1:价格表现出强烈的持续性——近期走势可能会继续(适用于趋势跟踪信号)。
- 接近 -1:强负自相关——价格常在相邻柱之间反转(适用于均值回归策略)。
- 接近 0:滞后 1 处无一致的线性关系——窗口内价格走势表现随机。
- 典型信号模式:阈值穿越(例如,>0.6 或 <−0.6)、相关性的持续上升/下降、价格与相关性的背离,或从其他系统过滤入场信号(趋势入场需相关性 > 0.5,反转设置需 < −0.5)。
交易思路
- 结合波动率过滤器(ATR)以避免低波动噪声期间的信号。
- 与趋势指标(移动平均线、MACD)配合使用,在相关性为正时确认方向。
- 当相关性强烈为负且价格处于支撑/阻力位或极端布林带时,作为短期均值回归触发信号。
- 短时间框架(如 M1–M15)和较短周期可用于剥头皮;较长周期/时间框架用于波段确认。
推荐设置
- 默认 Period = 20 作为起点效果良好。
- 短期:Period 8–14(剥头皮/日内)。
- 中期:Period 20–50(波段/趋势确认)。
- 避免在非常嘈杂的品种上设置过大 Period,或在非常缓慢的品种上设置过小 Period。
限制与注意事项
- 计算值至少需要 Period+1 根柱。
- 如果窗口内价格方差为零(价格持平),相关性分母可能为零——这可能导致 NaN/未定义结果。请使用合理的 Period 值并确保品种有足够的价格波动。
- 该指标仅测量线性滞后 1 的相关性;不检测非线性关系或多柱滞后。
- 非独立交易系统——最好作为策略中的过滤或确认工具使用。
建议包含在图库中的示例
- EURUSD H1,Period=20,显示趋势阶段的强相关性。
- BTCUSD 1H,显示振荡行为和负相关期。
- XAUUSD 15m,显示短周期剥头皮应用。
摘要
AI summary
RollingCorrelation is a technical indicator that calculates the rolling 1-period Pearson correlation of close prices over a configurable window, typically set to 20 bars. It measures the lag-1 autocorrelation of price data, producing values between -1 and +1. Values near +1 indicate strong positive autocorrelation, suggesting trend continuation, while values near -1 indicate strong negative autocorrelation, signaling oscillatory or reversal behavior. Values near zero imply little or no linear autocorrelation.
For each bar, the indicator computes the Pearson correlation coefficient between the series of close prices and the same series shifted by one bar within the specified period. This calculation uses standard covariance and variance formulas to generate a single correlation value per bar.
Traders can use this indicator to identify trend strength or potential reversals, applying threshold crossings or sustained changes in correlation as signals. It is useful for trend-following strategies when correlation is positive and for mean-reversion tactics when correlation is negative. The indicator can be combined with volatility filters and other trend indicators for confirmation. It supports various markets including Forex, stocks, indices, commodities, and cryptocurrencies, and is applicable across multiple timeframes from scalping (M1–M15) to swing trading.
The indicator requires at least Period+1 bars to compute values and is intended as a supplementary tool rather than a standalone trading system.
For each bar, the indicator computes the Pearson correlation coefficient between the series of close prices and the same series shifted by one bar within the specified period. This calculation uses standard covariance and variance formulas to generate a single correlation value per bar.
Traders can use this indicator to identify trend strength or potential reversals, applying threshold crossings or sustained changes in correlation as signals. It is useful for trend-following strategies when correlation is positive and for mean-reversion tactics when correlation is negative. The indicator can be combined with volatility filters and other trend indicators for confirmation. It supports various markets including Forex, stocks, indices, commodities, and cryptocurrencies, and is applicable across multiple timeframes from scalping (M1–M15) to swing trading.
The indicator requires at least Period+1 bars to compute values and is intended as a supplementary tool rather than a standalone trading system.
指标配置
客户评价
0.0
评价:0
客户评价
该产品尚无评价。已经试过了?抢先告诉其他人!
讨论
常见问答
Forex
Signal
Scalping
Indices
Commodities
Crypto
Stocks
cTrader Store 提供的所有产品,包括交易机器人、指标和插件,均由第三方开发者提供,仅供信息参考和技术访问之用。cTrader Store 并非经纪商,不提供投资建议、个人推荐或任何未来业绩保证。
该作者的其他作品


















价格
注册日期 16/01/2025
3.15M
交易量
2.04K
盈利点数
398
免费安装