
Cutrim Theory
指标
173 下载
版本 1.4, Jun 2026
Windows 版、Mac 版
说明
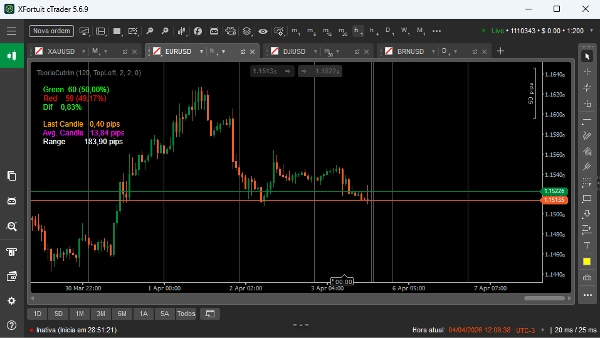
TeoriaCutrim 是一个统计叠加指标,旨在通过蜡烛图分布和波动性分析量化近期市场行为。它不是预测方向,而是提供关于市场在可配置的蜡烛窗口内刚刚发生了什么的客观数据。
分析的市场数据
该指标评估用户定义的最近蜡烛数量(回溯期)并提取:
- 看涨蜡烛的数量和百分比(收盘价 > 开盘价)
- 看跌蜡烛的数量和百分比(收盘价 < 开盘价)
- 看涨与看跌主导差异
- 平均蜡烛范围(以点数计)
- 当前蜡烛范围(以点数计)
- 分析窗口内的总价格范围
视觉输出与解读
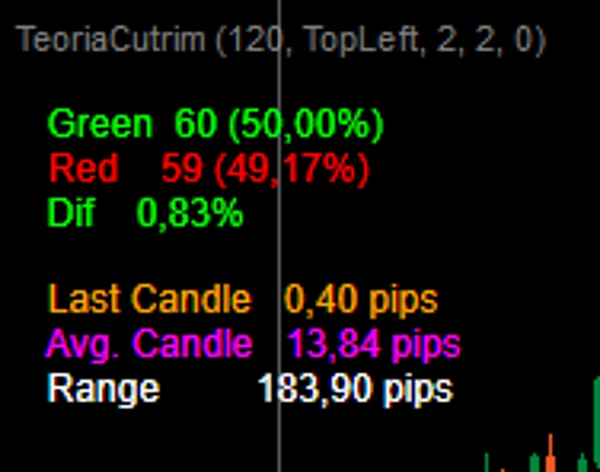
该指标直接在图表上显示关键指标:
- 绿色:总看涨蜡烛数及百分比
- 红色:总看跌蜡烛数及百分比
- Dif:看涨与看跌百分比的绝对差异
- 最后一根蜡烛:当前蜡烛大小(点数)
- 平均蜡烛:所选窗口内蜡烛的平均大小
- 范围:窗口内最高点与最低点之间的距离
解读非常直接:
- 较多的看涨蜡烛表明近期有上升压力
- 较多的看跌蜡烛表明近期有下降压力
- 较低的差异(Dif)表示平衡或随机性
- 平均蜡烛大小增加表示波动性扩大
- 较大的总范围表示市场扩张,较小的范围表示压缩
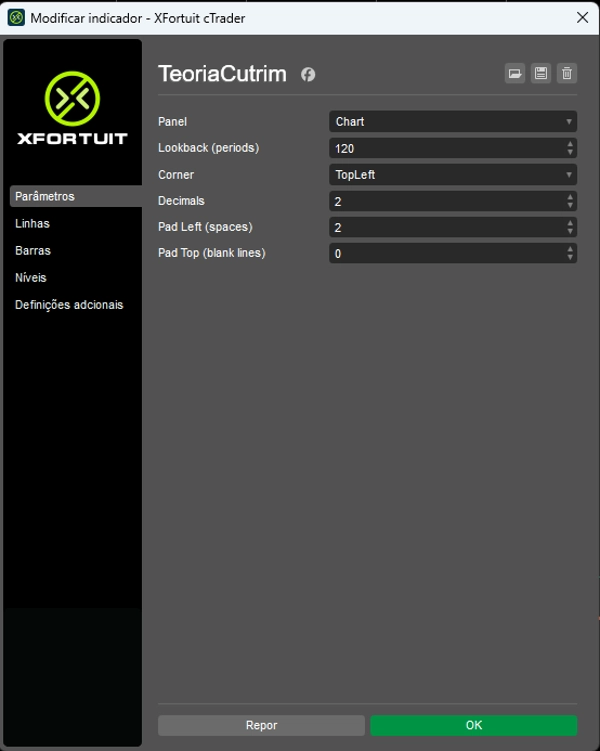
关键参数
- 回溯期:用于分析的蜡烛数量(完全可调)
- 角落:数据显示的位置
- 小数位数:显示的小数位数
- 左边距 / 上边距:视觉间距调整
使用场景
TeoriaCutrim 最适合作为背景工具,而非信号生成器。典型应用包括:
- 在入场交易前衡量统计不平衡
- 识别波动性扩张或收缩
- 基于近期蜡烛行为筛选交易
- 支持量化或概率基础策略
目标用户
该指标适用于依赖数据、统计和客观分析而非主观模式识别的交易者。适合自由裁量交易者和系统交易者。
摘要
AI 摘要
Cutrim Theory is a statistical overlay indicator that analyzes recent market behavior by examining a user-defined number of candles. It quantifies candle dominance, difference, and volatility in pips without predicting market direction. The indicator calculates and displays on the chart: the number and percentage of bullish and bearish candles, the absolute difference between bullish and bearish dominance, the current candle size, the average candle size, and the total price range within the selected window. These metrics help traders assess recent upward or downward pressure, market balance, and volatility expansion or contraction. Adjustable parameters include the lookback period, display position, decimal precision, and visual spacing. Designed for traders who prefer data-driven, objective analysis, Cutrim Theory serves as a context tool to measure statistical imbalances, identify volatility changes, filter trades based on candle behavior, and support quantitative or probability-based strategies. It is applicable to Forex markets, including EURUSD.
指标配置
客户评价
0.0
评价:0
客户评价
该产品尚无评价。已经试过了?抢先告诉其他人!
讨论
常见问答
Forex
EURUSD
cTrader Store 提供的所有产品,包括交易机器人、指标和插件,均由第三方开发者提供,仅供信息参考和技术访问之用。cTrader Store 并非经纪商,不提供投资建议、个人推荐或任何未来业绩保证。


!["Trend Angle Indicator [Iridio Capital]" 标识](https://cdn.ctrader.com/image/webp/28a98496-3412-4fea-82eb-be3347bdd6f1_27612)


价格
注册日期 31/03/2025
453.45M
交易量
759.44K
盈利点数
173
免费安装