说明
RSI Reversal Radar MTF Signals
This indicator allows scalpers to select up to 4 different MTF timeframes, including the 1-minute timeframe.
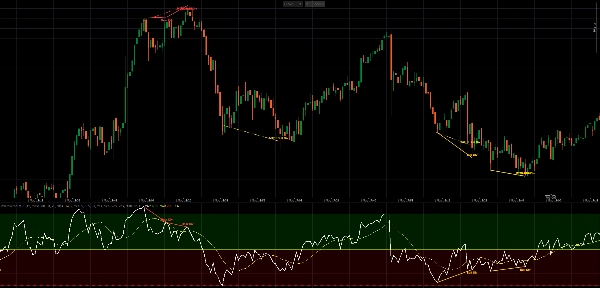
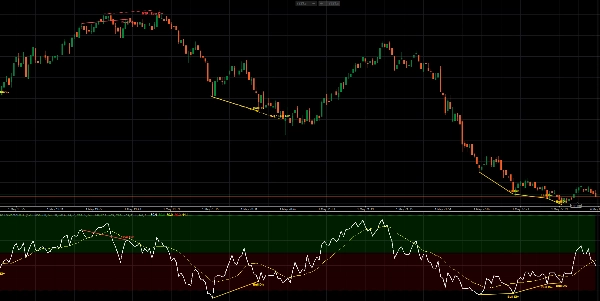
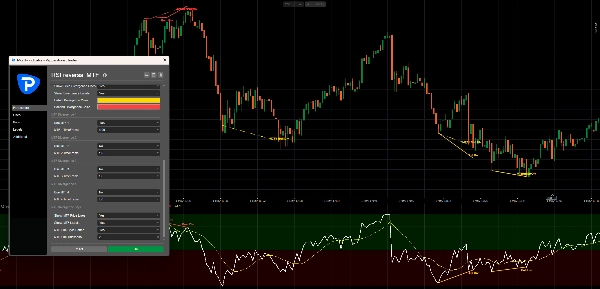
The selected MTF bullish or bearish divergence lines are drawn extra on the main price chart, giving scalpers additional potential reversal signals on top of the normal divergence from the current chart timeframe.
The RSI subwindow always stays based on your current chart timeframe.
Description
RSI Reversal Radar MTF Signals is an RSI-based cTrader indicator designed especially for traders who want to spot potential reversal signals across multiple timeframes.
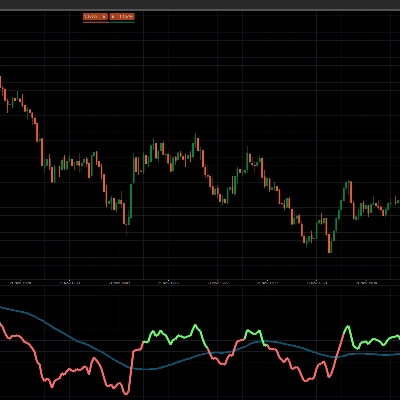
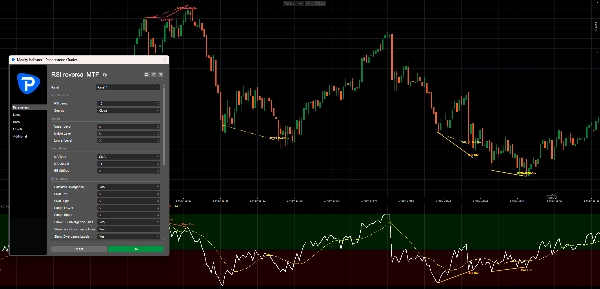
It includes a classic RSI panel with upper, middle, and lower levels, optional RSI smoothing, Bollinger Bands, cloud zones, and automatic bullish and bearish divergence detection.
The main feature is the multi-timeframe divergence system. You can enable up to 4 separate MTF slots, each with its own timeframe, such as:
1 Minute5 Minute15 Minute1 Hour
These selected MTF bullish and bearish divergence signals are drawn directly on the main price chart as extra reversal lines. This makes the indicator useful for scalpers who want to see lower-timeframe and higher-timeframe reversal pressure together on one chart.
How It Works
The indicator first calculates the RSI on your current chart timeframe.
For example, if you are trading on a 1-minute chart, the RSI subwindow remains based on the 1-minute chart data. The normal divergence system detects current-timeframe bullish and bearish divergence and draws those signals in the RSI window and on the main chart.
The divergence logic is:
Bullish divergence:Price makes a lower low,while RSI makes a higher low.Bearish divergence:Price makes a higher high,while RSI makes a lower high.
When MTF divergence is enabled, RSI Reversal Radar MTF Signals also checks your selected additional timeframes separately. Each selected timeframe calculates its own RSI and detects its own bullish or bearish divergence.
Those MTF signals are then drawn only on the main price chart as extra bullish or bearish reversal lines.
This means the RSI subwindow does not change when you select MTF timeframes. It stays clean and based on your current chart, while the main chart receives extra reversal signals from the selected timeframes.
Example Scalping Setup
A scalper could use:
Chart timeframe: 1 MinuteMTF 1: 1 MinuteMTF 2: 5 MinuteMTF 3: 15 MinuteMTF 4: 1 Hour
The main chart can then show:
Current chart divergence+ extra 1-minute MTF divergence+ extra 5-minute MTF divergence+ extra 15-minute MTF divergence+ extra 1-hour MTF divergence
This helps scalpers see when fast 1-minute reversal signals align with stronger signals from higher timeframes.
Key Features
- Built for scalpers and multi-timeframe traders
- Supports up to 4 selectable MTF divergence timeframes
- Includes 1-minute MTF support for fast scalping signals
- MTF bullish and bearish divergence lines are added extra on the main chart
- RSI subwindow stays based on the current chart timeframe
- RSI levels: 80, 50, and 20
- Green and red RSI cloud zones
- Optional RSI smoothing MA
- Supports SMA, EMA, SMMA/RMA, WMA, VWMA
- Optional SMA Bollinger Bands on RSI
- Automatic regular bullish divergence
- Automatic regular bearish divergence
- Normal divergence lines in the RSI subwindow
- Normal divergence lines on the main price chart
- Optional dotted or solid MTF line style
- Customizable MTF line thickness
- Optional labels for normal and MTF divergence signals
Practical Use
Bullish divergence can suggest that selling pressure may be weakening and that price could be preparing for an upward reversal.
Bearish divergence can suggest that buying pressure may be weakening and that price could be preparing for a downward reversal.
For scalpers, the most interesting areas are often where fast signals and higher-timeframe signals appear close together. For example, a 1-minute bullish divergence near a 5-minute or 15-minute bullish divergence may highlight a stronger potential reversal zone.
These signals are not meant to be used alone. They are best combined with market structure, support and resistance, trendlines, volume, or your own entry confirmation.