

Mô tả
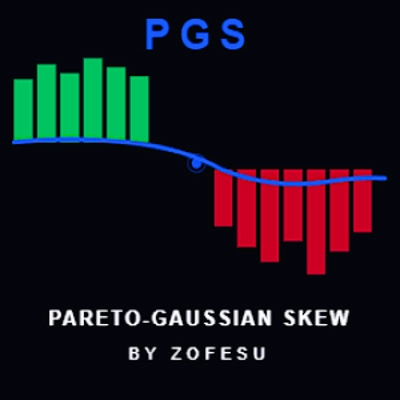
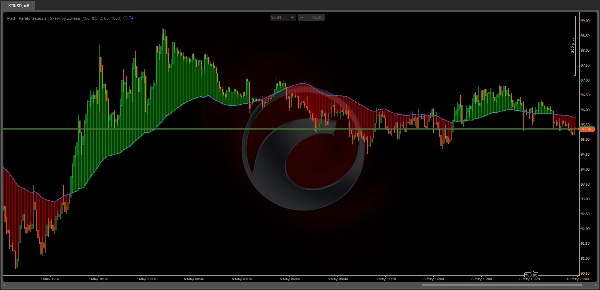
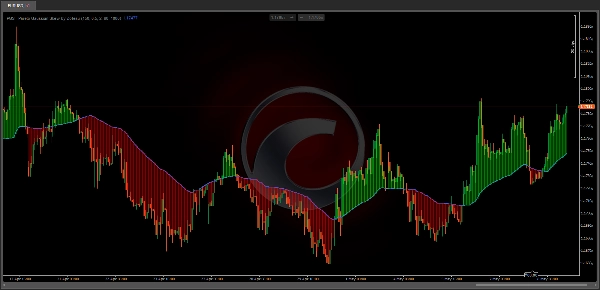
📊 PGS — Pareto-Gaussian Skew by Zofesu — Institutional Gravity Line & Tension Cloud. PGS is a precision overlay indicator built on two mathematical principles: the Gaussian distribution and the Pareto 80/20 rule. It identifies the invisible gravitational center of price — filtering out noise and focusing only on the 20% of moves that drive 80% of the trend.
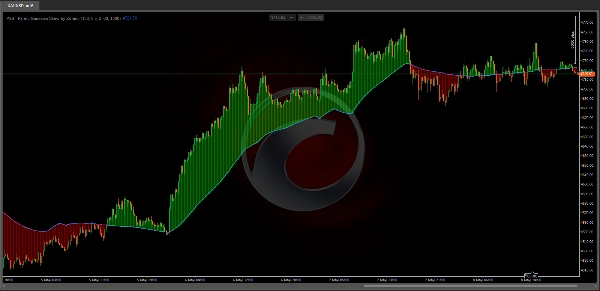
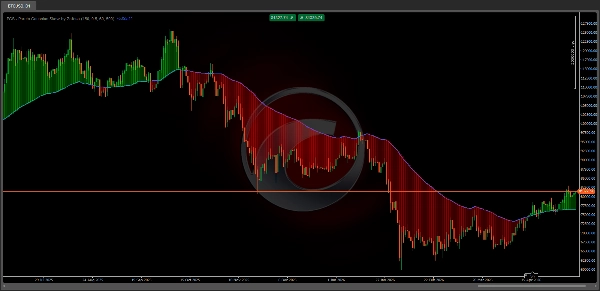
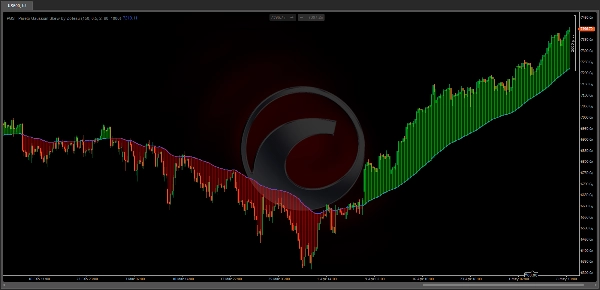
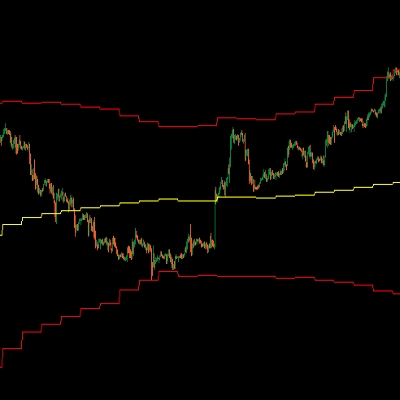
⚙ HOW IT WORKS The indicator calculates a dynamic baseline (SMA) and standard deviation over a configurable lookback window. Only price moves that exceed one standard deviation are considered statistically significant — these represent institutional displacement, not random noise. The Pareto Skew Factor amplifies these extreme moves and feeds them into an EMA smoother, producing a stable gravity line that adapts to market structure. The Tension Cloud fills the space between price and the gravity line: Green cloud (price > PGS line) — price is above gravity, bullish bias Red cloud (price < PGS line) — price is below gravity, bearish bias The wider the cloud, the more extended price is from its statistical center — a potential reversion zone.
🔑 KEY FEATURES
✅ Pareto-Gaussian gravity line — filters noise, reacts only to institutional moves
✅ Dynamic Tension Cloud — visualizes distance between price and gravity center
✅ Configurable Skew Factor — control sensitivity to extreme price displacement
✅ Adjustable lookback (Smith's Memory) — 20 to 500 bars
✅ Custom cloud colors and opacity — full visual control
✅ Max Cloud Bars limit — performance-optimized rendering
✅ Lightweight C# — no performance impact
📚 HOW TO USE
- Add PGS to any chart and timeframe
- Watch the PGS blue line — this is your gravity center
- Green cloud = price above gravity → look for long setups or trend continuation
- Red cloud = price below gravity → look for short setups or trend continuation
- Wide cloud = price is extended → potential mean reversion zone, reduce position size or wait
- Price crossing the PGS line = gravity shift → potential trend change
- Use in confluence with S/R levels, VWAP, or volume signals
Works on any TimeFrame and Asset: Indices (NAS100, SPX500), Forex, Gold, Crypto
🔗 PARAMETERS
- Smith's Memory (Lookback) — statistical window for SMA and StdDev calculation (default 150, range 20–500)
- Pareto Skew Factor — weight of extreme moves in gravity calculation (default 0.5, range 0.1–1.0)
- PGS line thickness can be adjusted via right-click → Format on the indicator or Properties → lines (default 2)
- Cloud Opacity (0–200) — transparency of the Tension Cloud (default 60, 0=Off)
- Max Cloud Bars — maximum number of bars rendered for the cloud (default 500)
- Bull Cloud Color — color when price is above gravity (default green)
- Bear Cloud Color — color when price is below gravity (default red)
📝 NOTES
- Higher Skew Factor (0.8–1.0) = gravity line reacts more aggressively to institutional moves
- Lower Skew Factor (0.1–0.3) = smoother, more conservative gravity line
- Higher Lookback = slower, macro-level gravity center
- Lower Lookback = faster, more reactive to recent price action
- Max Cloud Bars upper limit is 2000. Values above 1000 may impact performance. On lower timeframes (M5 and below) use 300 or less.
⚠️ DISCLAIMER Trading financial instruments involves substantial risk of loss. Past performance of any indicator or strategy does not guarantee future results. This tool is provided for informational and educational purposes only. Always use proper risk management and never risk more than you can afford to lose. The author is not responsible for any trading losses incurred through the use of this indicator.
Tóm tắt
Thảo luận
Đánh giá của khách hàng
Câu hỏi thường gặp
Sản phẩm khác của tác giả này










Giá