Описание
SC MACD Dots
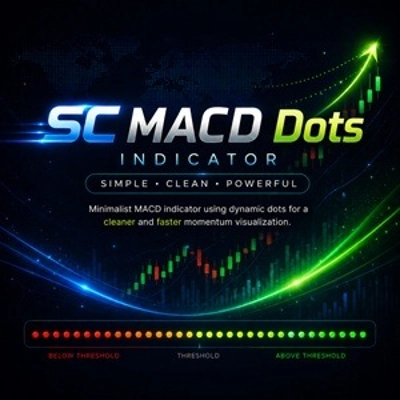
SC MACD Dots — это минималистичная версия классического индикатора MACD, разработанная для предоставления более чистого и интуитивно понятного отображения импульса без загромождения графика традиционными гистограммами и множеством линий.
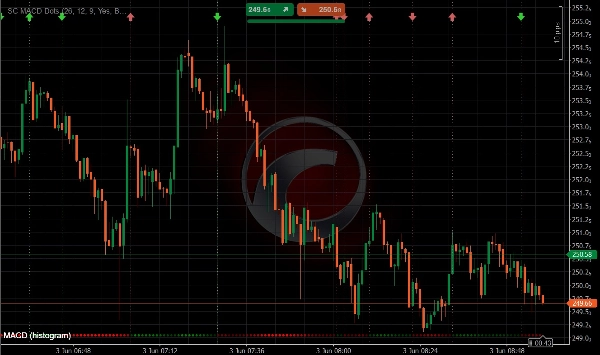
Вместо отображения стандартной гистограммы MACD индикатор использует динамические точки для представления значений гистограммы во времени. Такой подход создает современную и визуально эффективную компоновку, позволяющую трейдерам мгновенно выявлять изменения импульса, ускорение тренда и потенциальные развороты.
Точки адаптируют как цвет, так и интенсивность в зависимости от силы гистограммы, что облегчает распознавание увеличивающегося или уменьшающегося импульса с первого взгляда.
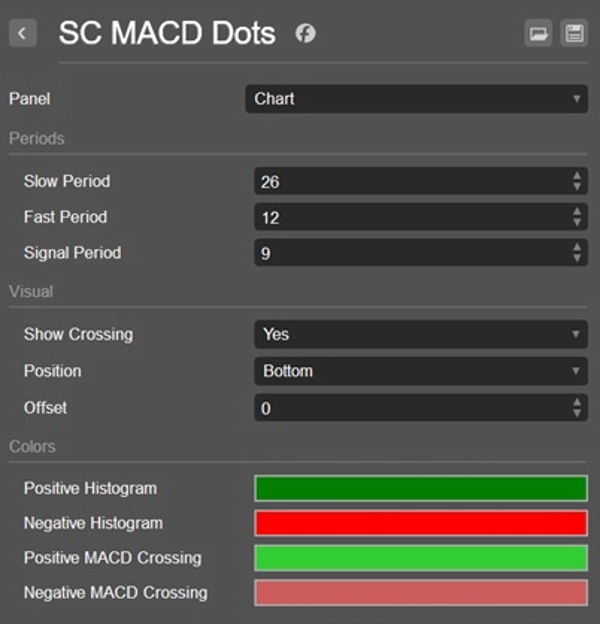
Кроме того, SC MACD Dots автоматически выделяет пересечения сигнальной линии MACD, позволяя трейдерам быстро выявлять потенциальные изменения тренда и сдвиги импульса.
Ключевые особенности
• Гистограмма отображается с помощью динамических точек вместо традиционных столбцов
• Более чистый и менее отвлекающий внешний вид графика
• Цвет и интенсивность точек динамически меняются в зависимости от силы гистограммы
• Мгновенное визуальное определение увеличивающегося и уменьшающегося импульса
• Автоматическое обнаружение событий пересечения MACD
• Разные цвета для восходящих и нисходящих пересечений
• Пересечения в положительной и отрицательной зонах используют разные визуальные стили
• Быстрая визуальная интерпретация сдвигов импульса и разворотов тренда
• Идеально подходит для скальпинга, внутридневной торговли, свинг-трейдинга и дискреционной торговли
Визуализация пересечений
SC MACD Dots выделяет каждое событие пересечения MACD:
• Восходящие пересечения (бычьи) отображаются с использованием специальных бычьих цветов
• Нисходящие пересечения (медвежьи) отображаются с использованием специальных медвежьих цветов
• Пересечения, происходящие выше нулевой линии (положительная зона MACD), используют другую цветовую схему, чем те, что происходят ниже нулевой линии (отрицательная зона MACD)
• Это позволяет трейдерам мгновенно различать более сильные и более слабые сигналы импульса
Почему стоит использовать SC MACD Dots
Традиционные индикаторы MACD часто требуют от трейдеров одновременно отслеживать несколько линий и столбцов гистограммы, что может делать графики загроможденными и трудночитаемыми.
SC MACD Dots был создан с одной целью:
упростить анализ MACD, сохраняя при этом всю важную информацию об импульсе.
Адаптивная визуализация точек позволяет трейдерам быстро оценивать силу гистограммы, ускорение и замедление импульса, а также сигналы пересечения без отвлекающих ненужных визуальных элементов.
Объединяя динамические точки гистограммы с интеллектуальной визуализацией пересечений, трейдеры могут быстрее выявлять возможности и поддерживать более чистое рабочее пространство для торговли.
Идеально подходит для
• Трейдеров, предпочитающих чистые графики
• Трейдеров, ориентированных на импульс
• Скальперов и внутридневных трейдеров
• Свинг-трейдеров
• Настроек с несколькими индикаторами
• Быстрого анализа рынка
• Трейдеров, полагающихся на сигналы пересечения MACD
Важное замечание
SC MACD Dots предназначен для использования непосредственно на основном графике цены.
В отличие от традиционных индикаторов MACD, его визуальная концепция построена вокруг интеграции информации об импульсе в анализ ценового действия. По этой причине использование индикатора в отдельной панели не рекомендуется и не обеспечивает ожидаемый пользовательский опыт.
Просто. Чисто. Мощно.
Сводка
Обсуждение
Отзывы покупателей
5 | 100 % | |
4 | 0 % | |
3 | 0 % | |
2 | 0 % | |
1 | 0 % |