
说明
SC 支撑与阻力
每位交易者都应拥有的专业支撑与阻力工具
SC 支撑与阻力 是一款先进的价格行为指标,旨在自动识别、管理并在图表上直观显示动态的 支撑和阻力区域。
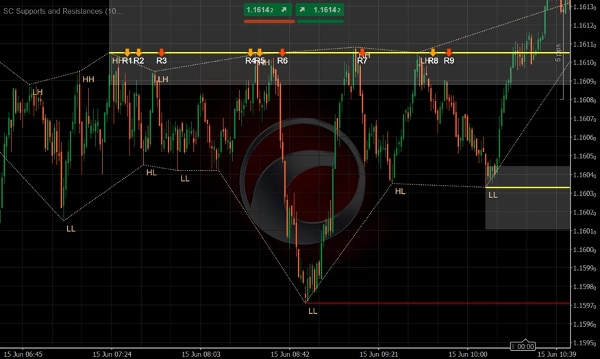
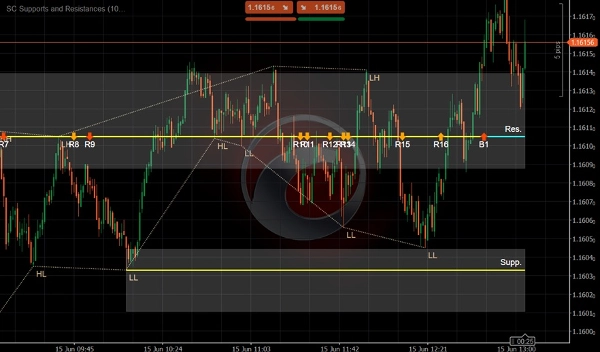
不同于依赖简单水平线的传统支撑与阻力工具,SC 支撑与阻力 使用自适应的 基于ATR的带状区域 来表示真实的市场反应区域,帮助交易者理解价格最可能被拒绝、盘整或突破的位置。
该指标持续分析市场波动以检测重要的支撑和阻力水平,跟踪价格随时间与每个区域的互动,并自动将每次反应分类为 拒绝 或 突破。强烈反应会被单独突出显示,使交易者能够立即区分次要测试和重要的市场事件。
通过结合智能水平检测、动态区域管理和实时反应分析,SC 支撑与阻力 将支撑与阻力交易转变为一个客观且可衡量的过程。
主要特点
✔ 自动检测重要的支撑和阻力区域
✔ 适应市场波动的动态ATR带状区域
✔ 自动识别拒绝和突破
✔ 检测强烈拒绝和强烈突破
✔ 实时跟踪水平强度和市场反应
✔ 基于价格行为的智能波动水平识别
✔ 自动过期过时水平,保持图表整洁
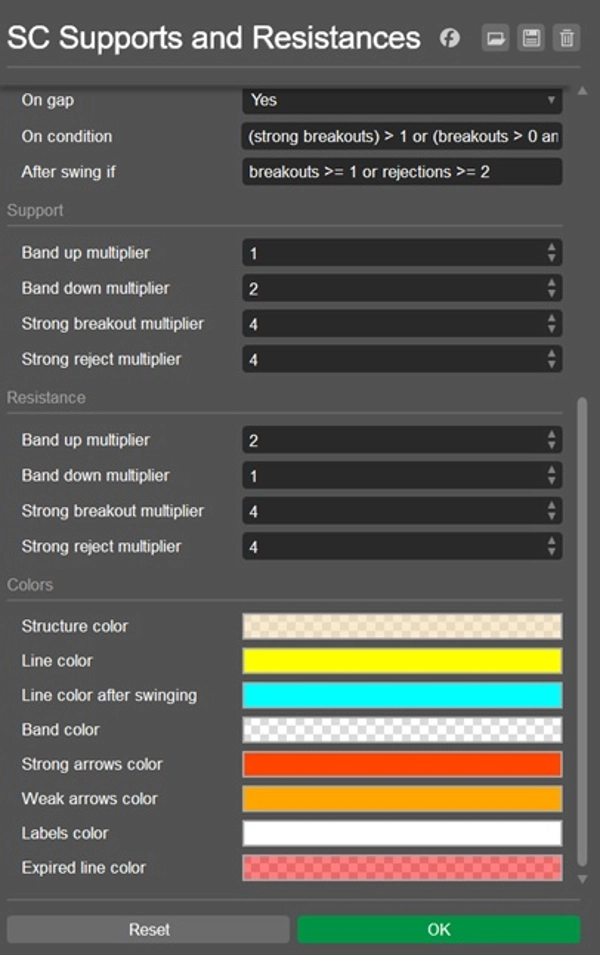
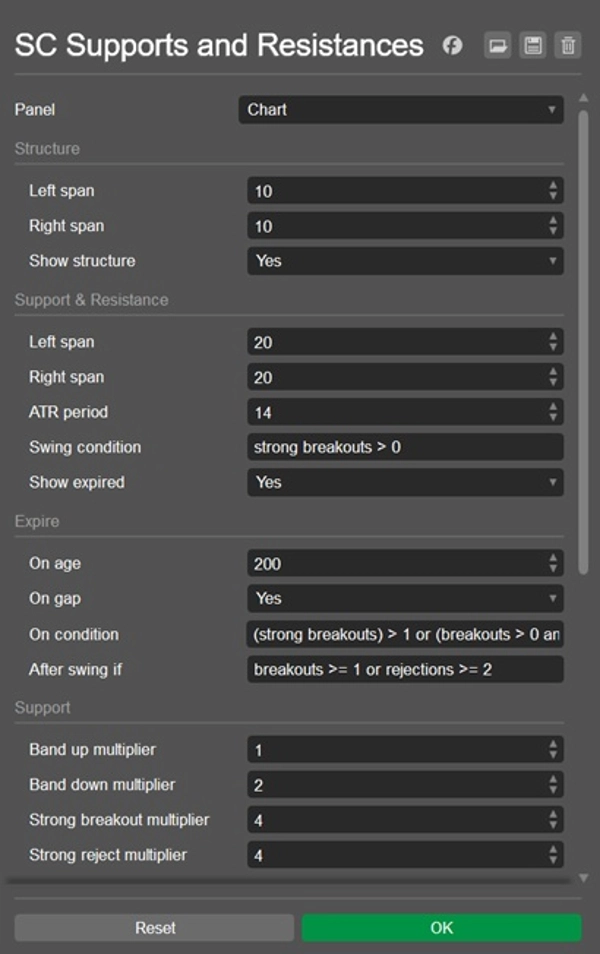
✔ 完全可自定义的灵敏度和反应标准
✔ 通过带状区域、箭头、标签和统计数据清晰展示
✔ 适用于所有市场和所有时间框架
高级水平智能
SC 支撑与阻力 不仅仅是简单地绘制水平线。
每个检测到的区域都会根据市场的互动不断演变。该指标持续监控:
- 拒绝
- 突破
- 强烈拒绝
- 强烈突破
- 水平年龄
- 波动形成
随着市场条件的变化,水平可以自动获得重要性,成为重要的波动水平,或者在不再相关时过期。
这创造了一个动态的支撑与阻力框架,反映了实际的市场行为,而非静态的历史线条。
动态带状区域替代单一线条
市场很少对精确价格做出反应。
因此,SC 支撑与阻力 将每个水平表示为一个动态价格区域,其大小通过ATR计算自动适应波动性。
这提供了更真实的供需区域表现,同时减少了由无意义价格穿透产生的假信号。
结果是更清晰、更准确地展示市场参与者真正防守价格的位置。
基于反应的交易信号
每次与支撑或阻力区域的互动都会实时评估。
当价格拒绝某一区域时,指标会生成明确的方向性信号。当价格成功突破某一水平时,会生成突破信号并根据其强度进行分类。
这使交易者能够立即识别:
- 潜在的反转机会
- 趋势延续形态
- 突破确认
- 失败的突破尝试
- 高关注度的机构反应区域
自动水平生命周期管理
支撑与阻力交易中最大的挑战之一是确定何时某个水平不再相关。
SC 支撑与阻力 通过基于以下因素的智能过期逻辑,自动管理每个水平的整个生命周期:
- 市场不活跃
- 价格跳空
- 突破行为
- 拒绝行为
- 波动确认逻辑
结果是图表只关注仍然重要的水平,消除不必要的杂乱和过时信息。
为何使用 SC 支撑与阻力
支撑与阻力仍然是技术分析中最重要的概念之一,但许多交易者仍然手动绘制水平,导致主观解释和结果不一致。
SC 支撑与阻力 通过提供一种客观、基于规则的方法来识别和管理关键市场水平,消除了这种不确定性。
这使交易者能够:
✔ 更快识别高概率反应区域
✔ 衡量支撑和阻力水平的强度
✔ 即时检测有意义的突破和拒绝
✔ 改善进出场时机
✔ 减少图表杂乱
✔ 更有信心和一致性地交易
适合人群
- 价格行为交易者
- 剥头皮交易者
- 日内交易者
- 波段交易者
- 趋势交易者
- 智能资金概念(SMC)交易者
- 支撑与阻力交易者
- 专业技术分析师
重要提示
SC 支撑与阻力 使用已确认的市场枢轴点和自适应波动性计算来识别水平。
生成水平的质量和频率取决于所选的灵敏度设置和反应参数。
调整这些设置允许交易者根据不同市场、交易风格和时间框架定制指标。
识别水平。衡量反应。
交易真正重要的内容。
摘要
Key functionalities include automatic detection and expiration of levels, intelligent swing-level recognition, and customizable sensitivity settings. Visual outputs feature dynamic bands, arrows, labels, and statistics to clearly represent zones and market reactions. This tool supports all markets and timeframes, providing objective, rules-based identification of key price levels to assist traders in recognizing potential reversals, trend continuations, breakout confirmations, and institutional reaction zones.
SC Supports & Resistances is suitable for various trading styles, including price action, scalping, day trading, swing trading, trend trading, and Smart Money Concept approaches. It aims to reduce chart clutter and improve entry and exit timing by maintaining a living framework of relevant support and resistance levels that evolve with market behavior.


