说明
SC 市场结构
SC 市场结构 是一个视觉市场结构指标,旨在自动识别并直接在图表上显示最重要的摆动高点和摆动低点。
该指标持续分析价格行为,通过连接重要的高点和低点并绘制动态结构线来映射市场结构的演变。这使交易者能够即时识别趋势方向、趋势延续和潜在的反转点,而无需手动标记市场摆动。
此外,SC 市场结构会根据标准市场结构定义自动分类每一个新的结构点:
- HH(更高高点)
- HL(更高低点)
- LH(更低高点)
- LL(更低低点)
通过结合自动摆动检测与实时市场结构标注,交易者可以快速了解市场是处于趋势中、盘整中,还是显示潜在趋势反转的迹象。
主要特点
• 自动检测重要的摆动高点和摆动低点
• 连接市场枢轴点的动态结构线
• 自动识别更高高点(HH)
• 自动识别更高低点(HL)
• 自动识别更低高点(LH)
• 自动识别更低低点(LL)
• 清晰展示多头和空头市场结构
• 即时识别趋势延续和反转形态
• 适用于所有市场和时间框架
• 干净且直观的图表展示
市场结构可视化
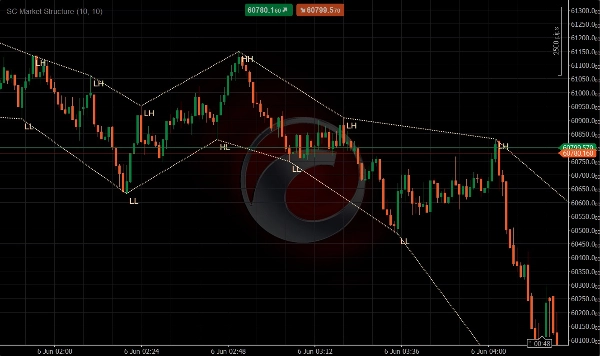
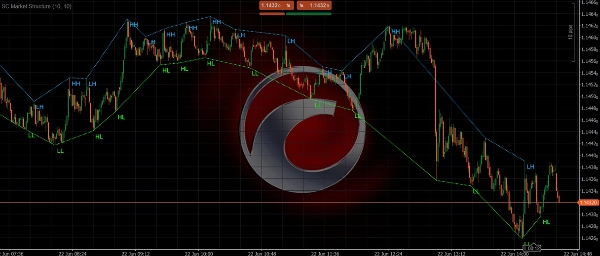
SC 市场结构持续评估价格摆动,并标注每一个新确认的结构点。
多头结构
当价格形成以下结构时,识别为多头市场结构:
• 更高高点(HH)
• 更高低点(HL)
这一序列表明买方仍然掌控市场,上升趋势依然存在。
空头结构
当价格形成以下结构时,识别为空头市场结构:
• 更低高点(LH)
• 更低低点(LL)
这一序列表明卖方仍然掌控市场,下跌趋势依然存在。
该指标通过动态趋势线直观地连接这些结构点,使交易者能够实时跟踪价格结构的演变。
为何使用 SC 市场结构
理解市场结构是价格行为交易中最重要的方面之一。
许多交易者手动绘制摆动高点、摆动低点和趋势结构,这既费时又主观。
SC 市场结构通过客观识别结构枢轴点并根据专业市场结构原则进行标注,实现了这一过程的自动化。
这使交易者能够:
• 更快读取趋势方向
• 更早识别潜在反转
• 确认趋势延续形态
• 改善进出场时机
• 保持图表更清晰、更有条理
适用人群
• 价格行为交易者
• 短线交易者
• 日内交易者
• 摆动交易者
• 趋势跟随交易者
• 市场结构交易者
• 智能资金概念(SMC)交易者
• 寻求客观结构分析的交易者
重要提示
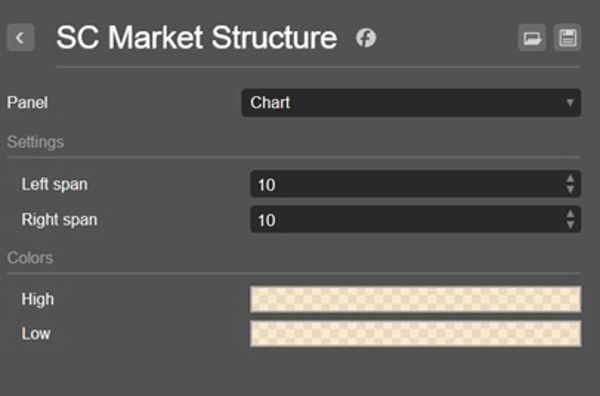
SC 市场结构基于已确认的摆动高点和摆动低点识别市场结构。标签和结构线仅在枢轴点经过所选计算设置验证后生成。
调整灵敏度设置将影响新结构点的识别和显示频率。
与传统的 MACD 指标不同,其视觉概念是围绕将动量信息整合到价格行为分析中构建的。因此,不建议在单独面板中使用该指标,这样做无法提供预期的用户体验。
读取趋势。遵循结构。自信交易。
摘要
By continuously analyzing price action, SC Market Structure helps traders quickly determine trend direction, recognize trend continuation, and spot potential reversal points without manual chart annotations. It supports all markets and timeframes, providing a clean and intuitive chart presentation.
This tool is suited for price action traders, scalpers, day traders, swing traders, trend followers, and those using Smart Money Concepts or seeking objective market structure analysis. Sensitivity settings allow customization of pivot detection frequency. The indicator integrates momentum information into price action analysis and is designed for direct chart overlay rather than separate panels.
客户评价
5 | 100 % | |
4 | 0 % | |
3 | 0 % | |
2 | 0 % | |
1 | 0 % |