

present
注册即可在首次购物时获得 $50 优惠
Trading product for MultiTimeframe OHLC Bias Dashboard 指标 Engulfing Key Levels, image 1
MultiTimeframe OHLC Bias Dashboard
指标
版本 1.0, Aug 2026
Windows 版、Mac 版
Trading product for MultiTimeframe OHLC Bias Dashboard 指标 Engulfing Key Levels, image 2
Trading product for MultiTimeframe OHLC Bias Dashboard 指标 Engulfing Key Levels, image 3
Trading product for MultiTimeframe OHLC Bias Dashboard 指标 Engulfing Key Levels, image 4
Trading product for MultiTimeframe OHLC Bias Dashboard 指标 Engulfing Key Levels, image 5
Trading product for MultiTimeframe OHLC Bias Dashboard 指标 Engulfing Key Levels, image 6
Trading product for MultiTimeframe OHLC Bias Dashboard 指标 Engulfing Key Levels, image 7
Trading product for MultiTimeframe OHLC Bias Dashboard 指标 Engulfing Key Levels, image 8
注册日期 08/08/2026

说明

What it does

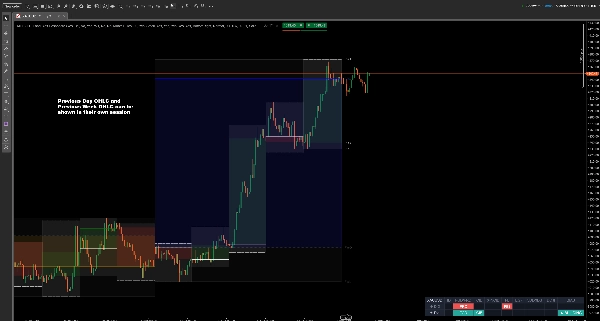
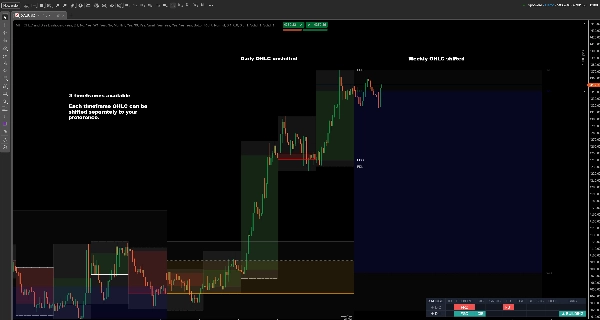
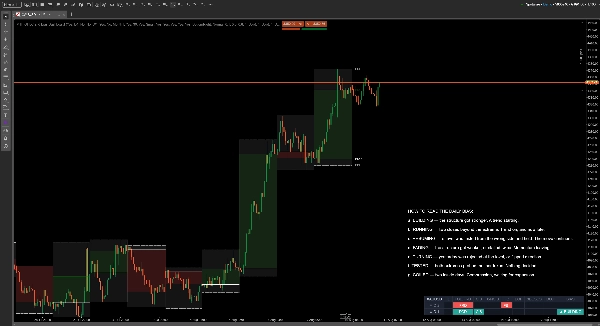
MULTI-TIMEFRAME OHLC and BIAS DASHBOARD is a multi-timeframe price action indicator for cTrader. It draws the previous day, previous week and previous month OHLC levels — open, high, low and close — onto your chart, and adds a dashboard that reads what price actually did at those levels over the last two completed days.

Previous day high and low (PDH and PDL), the daily open, the weekly high and low: these are the higher timeframe support and resistance levels most intraday and swing traders already work from. What they usually do by eye every morning is compare them — did yesterday close above the day before? Did price poke through the previous day high and fail? Is the move building or running out of room? This indicator answers those questions on the chart, in one row.


Multi-timeframe OHLC levels

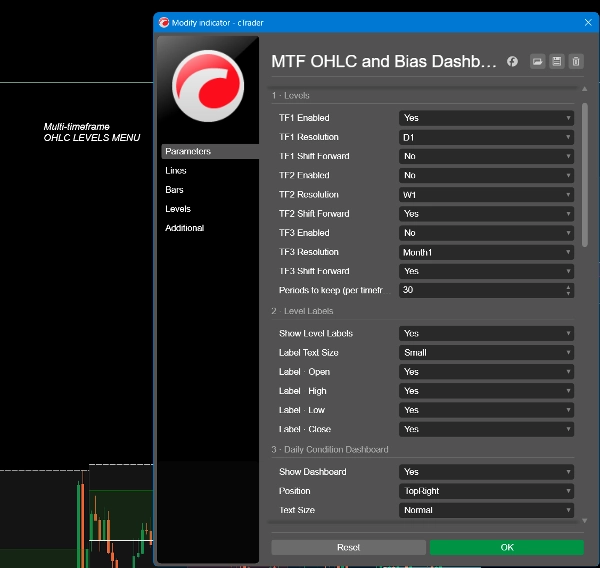
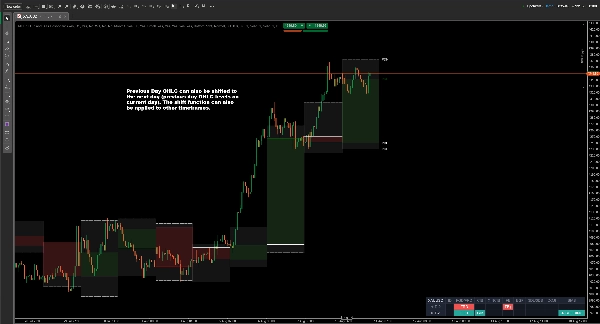
Up to three timeframes at once — daily, weekly, monthly, or any resolution you choose. Each draws its open, high, low and close, with an optional shaded body and a high-to-low band. Levels can be shifted forward so the current period's reference sits ahead of price rather than behind it, and you can keep up to 70 historical periods on the chart.

Every line has its own colour, thickness and style, so a weekly support level never gets confused with a daily one.


The daily condition dashboard

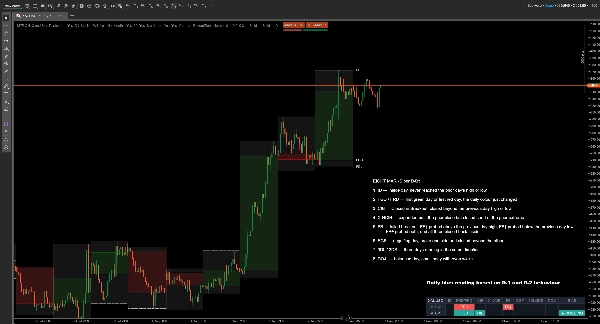
The dashboard grades the last two completed daily candles — D-1 (yesterday) and D-2 (the day before) — each against the day that preceded it.

Nine marks per day:

  • ID — inside day, never reached the prior day's high or low
  • FGD / FRD — first green day or first red day, the daily colour just changed (Green is bull day and Red is bear day)
  • CIB — Closed in Breakout, closed beyond the previous day high or low
  • X-NCIB — expanded past the prior close but closed short of the prior extreme (Expand Not Closed In Breakout = X-NCIB)
  • FB — failed breakout: FB↑ probed above the previous day high, FB↓ probed below the previous day low, FB± probed both, and all three closed back inside
  • EGF — engulfing day, broke one side and closed beyond the other
  • 3DL / 3DS — three days running in the same direction (3 Days of Long = 3DL/ 3 Days of Short = 3DS)
  • DOJI — balanced day, small body with even wicks
  • BIAS — the reading, explained below


How to read the daily bias

The bias is the part that saves you the work. Each day collapses to a single state, and the bias comes from the movement between D-2 and D-1 — not from yesterday alone. The same mark means different things depending on what preceded it, and that is exactly what a single-day dashboard cannot tell you.

  • BUILDING — the structure got stronger. A trend starting.
  • RUNNING — two closes beyond the extreme. Trend on, and now late.
  • RESUMING — a level was tested from the wrong side and held. The move continues.
  • FADING — the structure got weaker, or stalled twice. Momentum leaving.
  • TURNING — yesterday was rejected at the level, or flipped direction.
  • TESTED — both extremes probed, neither taken. Nothing decided.
  • COILED — two inside days. Compression, waiting for expansion.

An arrow and colour carry the direction: green up for bullish, red down for bearish, neutral grey when there is no direction to give.

Both detail rows stay visible above the bias, so you can always see why it reads the way it does rather than trusting a black box.


Typical use

Open the chart in the morning, read the bias, and know before the session starts whether you are looking for continuation, a fade, or a range. Then trade your own setups against the drawn levels — the previous day high and low, the daily open, the weekly extremes.

It suits opening-range work, failed-breakout trading, and day-to-day continuation strategies. Useful across forex, indices, metals and crypto.


Settings

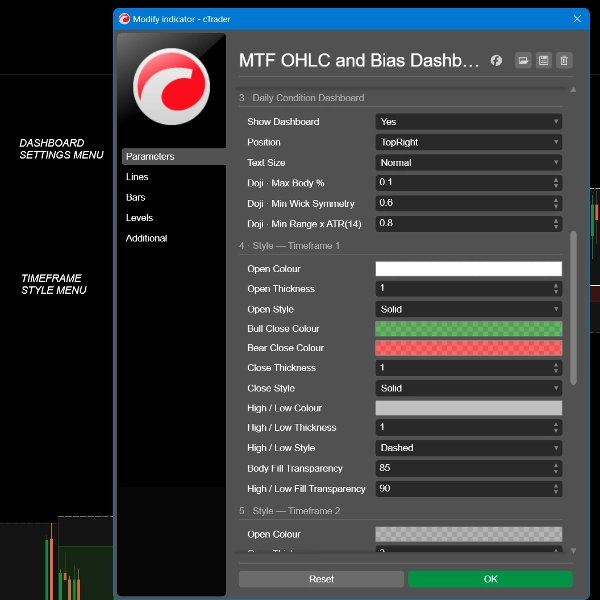
  • Three independent timeframe slots, each with its own resolution, shift-forward toggle and full colour, thickness and style controls
  • Number of historical periods to keep, up to 70
  • Level labels on or off, per line type, with adjustable text size
  • Dashboard on or off, five screen positions, four text sizes
  • Doji sensitivity: maximum body percentage, minimum wick symmetry, minimum range relative to the 14-day average

******************************************************

Who it's for

Intraday and swing traders who already work from previous day and previous week levels. It assumes you know what a previous day high is and why it matters. If those levels are not already part of how you trade, this will not teach you to use them.

What it does not do

Being clear about this now saves us both time later:

  • It gives no buy or sell signals, and no entry or exit prices
  • It places no orders and cannot touch your account — the indicator runs with no access rights at all
  • It has no alerts or notifications
  • It predicts nothing. Every mark describes candles that have already closed
  • It does not repaint. The dashboard reads only completed daily candles, so a reading never changes after the fact
  • It is not a strategy. The bias describes structure; it does not recommend a trade

********************************************************

Things worth knowing

The dashboard needs at least four completed daily candles, so a newly listed symbol will show dashes until it has enough history.

Daily candles start at your broker's server time. Two brokers on the same instrument can cut the day at different hours, which means the same symbol can legitimately read differently on two platforms. That is a property of the data, not a fault in the indicator.

Above the daily timeframe the dashboard cannot read daily data and shows a TF > D warning. The levels still draw.

Trading involves risk. Past performance does not guarantee future results.

摘要

指标配置
指标分类
市场结构(SMC)
输出类型
可视化
数据要求
仅 K 线
跳动点数据

客户评价

0.0
评价:0
客户评价
该产品尚无评价。已经试过了?抢先告诉其他人!

讨论

常见问答

Engulfing
Key Levels
Market Structure
Doji
Support & Resistance
cTrader Store 提供的所有产品,包括交易机器人、指标和插件,均由第三方开发者提供,仅供信息参考和技术访问之用。cTrader Store 并非经纪商,不提供投资建议、个人推荐或任何未来业绩保证。

该作者的其他作品

指标
Engulfing
Fibonacci
+4
Six higher-timeframe candle sets on one chart, with liquidity sweep detection and swept levels.

猜您喜欢

指标
Prop
Forex
+11
⚡Nebula Range Filter is a professional trend filter indicator for cTrader⚡
指标
Imbalance
Inside Bar
+3
A clean and powerful Smart Money Concepts tool combining Fair Value Gaps, Previous Daily High/Low, Inside/Outside bar
指标
MACD
Prop
+14
Enhance MACD Histogram! Visualize bull and bear price changes with vibrant colors for clearer, more insightful trading.
指标
BOS
CHOCH
+3
Identifies HH, HL, LH, and LL swing points using fractals. Essential for Smart Money Concepts and price action.
指标
Triangle
Double Top
+5
Know which liquidity sweeps are real. Auto-tracks EQH/EQL and confirms genuine reversals, not just broken levels.
指标
Laser entries with pivot confirmation. No repaint, all timeframes. Professional results.
"MARainbow" 标识
评分最高
4.2
(4)
$19
/
$38
指标
Forex
Crypto
+3
MARainbow gives you the edge with four customizable moving averages—each color-coded for instant recognition.
指标
Volume
Key Levels
+4
Margin Zones its CME-based support/resistance levels from price extremes, helps traders spot entries and exits NKZ zones
指标
ATR
Prop
+7
Smart momentum tool uses advanced filtering and colour cues for clearer market direction and trading signals.
指标
MACD
Forex
+1
😎Read the description before purchasing💩
指标
Pin Bar
Inducement
+5
Institutional Nasdaq Session Liquidity Map with Live Point HUD, Sweep Alerts & Interactive Playbook.
指标
Forex
Crypto
+6
The cTrader Chaos Reversals indicator brings high-quality reversal signals to traders.
指标
BOS
Volume
+5
20/40/60-day IPDA lookback ranges, Premium/Discount/Equilibrium zones, and quarterly shift alerts — anchored to true dai
指标
Forex
Crypto
+4
Pro Heikin Ashi Visual Overlay – Clean Trend Visualization
指标
MultiTF Pivot and SR Indicator
指标
RSI
Signal
+1
🚀📈 Plot buy/sell signals on Range Bars using Moving Averages and RSI. Clear, actionable trading insights.🚀📈
指标
Spot Strong Trends Early & Filter Market Noise
指标
Bollinger
Jurik Moving Average (Jurik's Moving Average) triple adaptive filter with unique Jurik smoothing and dynamic factor.

价格

注册日期 08/08/2026


















