

说明
强大的超级趋势将市场走势转化为清晰的地图
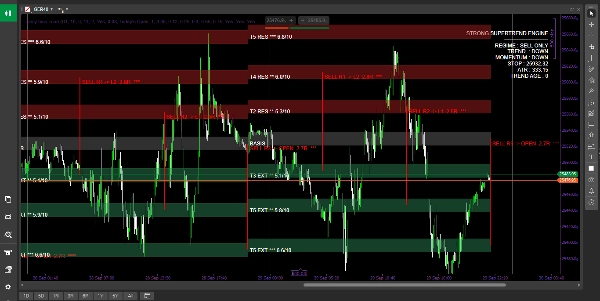
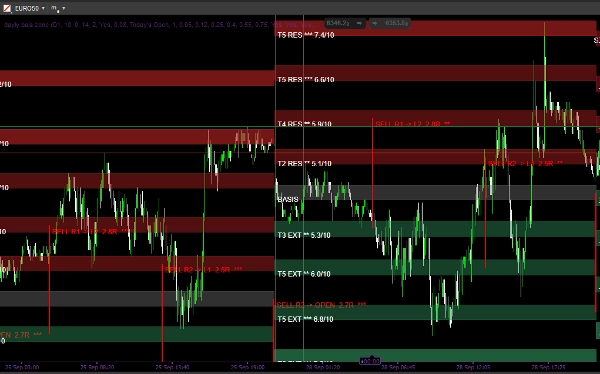
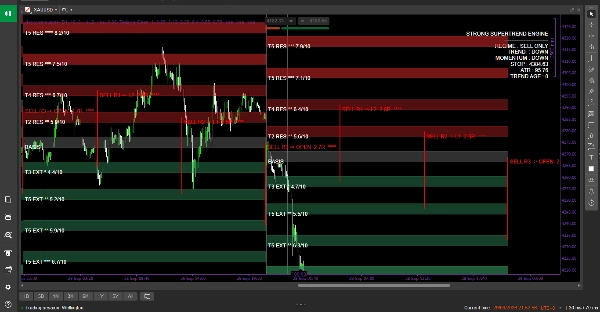
市场分析不再仅仅是寻找买入或卖出信号。 强大的超级趋势引擎旨在通过将趋势、波动性、动量和价格区间转化为易于阅读的动态地图,为您提供更广阔的市场视角。该指标依赖于 超级趋势、ATR 和基准来构建清晰的市场结构,然后识别价格周围的多个层级,并以 0 到 10的评分评估每个区域的强度,帮助您识别值得关注的区域。通过 Laguerre 动量分析和定制的仪表盘界面,您可以一目了然地看到趋势、动量状态和市场层级,以及潜在的延续情景和风险回报比。该指标不仅仅是一个在图表上给出箭头的工具;它是一个 综合分析系统,将复杂的价格行为转化为有序的地图,帮助您理解市场的运动方向、关键区域以及在做出决策前何时需要进一步确认。
使用方法:首先阅读仪表盘以确定整体市场状况、趋势和动量。然后,使用基准作为参考点来了解价格位置,同时监控其上下方的五个区域层级,更加关注评分较高的区域。使用超级趋势区域作为趋势以及支撑或阻力的额外参考,观察价格如何与指定区域互动,而不是盲目在价格达到时进入。随后,可以使用较小的时间框架确认价格行为并确定入场点、止损和目标。同时,指标显示的延续情景作为潜在的持续运动可视化,而非自动交易指令。通过这种方式,指标充当了一个 决策地图:它首先定义了背景和关键区域,交易者则负责入场确认和风险管理。
摘要
AI summary
StrongSupertrend is a comprehensive trading indicator that transforms market movement into a clear, dynamic map by integrating trend, volatility, momentum, and price zones. It combines Supertrend, Average True Range (ATR), and Basis calculations to construct a structured market overview, highlighting multiple price levels with strength scores ranging from 0 to 10. The indicator incorporates Laguerre Momentum analysis and presents data through a custom Dashboard interface, enabling users to quickly assess trend direction, momentum status, key market zones, and potential continuation scenarios alongside risk-to-reward ratios.
Users start by interpreting the Dashboard to gauge overall market conditions, then use the Basis as a price reference point while monitoring five zone layers above and below it, focusing on higher-rated zones. The Supertrend zone serves as an additional trend and support/resistance reference. Price interactions with these zones guide decision-making rather than triggering automatic entries. Traders can confirm entries, stop losses, and targets using smaller timeframes. Continuation scenarios provide visual forecasts of possible market moves without automated orders. This indicator functions as a decision-making tool that organizes complex price action into an accessible format, supporting informed trading decisions. It supports visualization outputs and signals including trend strength, volatility regime, level breaks, and level touches, relying on bar and volume data inputs.
Users start by interpreting the Dashboard to gauge overall market conditions, then use the Basis as a price reference point while monitoring five zone layers above and below it, focusing on higher-rated zones. The Supertrend zone serves as an additional trend and support/resistance reference. Price interactions with these zones guide decision-making rather than triggering automatic entries. Traders can confirm entries, stop losses, and targets using smaller timeframes. Continuation scenarios provide visual forecasts of possible market moves without automated orders. This indicator functions as a decision-making tool that organizes complex price action into an accessible format, supporting informed trading decisions. It supports visualization outputs and signals including trend strength, volatility regime, level breaks, and level touches, relying on bar and volume data inputs.
指标配置
指标分类
趋势
输出类型
可视化
数据要求
仅 K 线
交易量
支持的信号
趋势强度
波动性
突破水平位
触及水平位
客户评价
0.0
评价:0
客户评价
该产品尚无评价。已经试过了?抢先告诉其他人!
讨论
常见问答
Keltner Channels
Key Levels
ATR
Wedge
cTrader Store 提供的所有产品,包括交易机器人、指标和插件,均由第三方开发者提供,仅供信息参考和技术访问之用。cTrader Store 并非经纪商,不提供投资建议、个人推荐或任何未来业绩保证。
该作者的其他作品






价格
注册日期 23/06/2025
1
销售