present
注册即可在首次购物时获得 $50 优惠
Trading product for VWAP Ribbons 指标 RSI Volume, image 1
VWAP Ribbons
指标
131 下载
版本 1.0, Sep 2026
Windows 版、Mac 版
4.7
评价:4
Trading product for VWAP Ribbons 指标 RSI Volume, image 2
Trading product for VWAP Ribbons 指标 RSI Volume, image 3
Trading product for VWAP Ribbons 指标 RSI Volume, image 4
Trading product for VWAP Ribbons 指标 RSI Volume, image 5
注册日期 14/01/2025
5
销售
424
免费安装

说明

VWAP 缎带
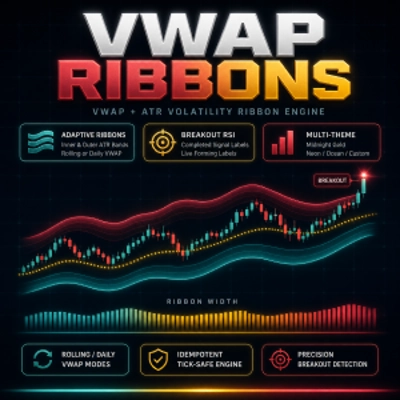
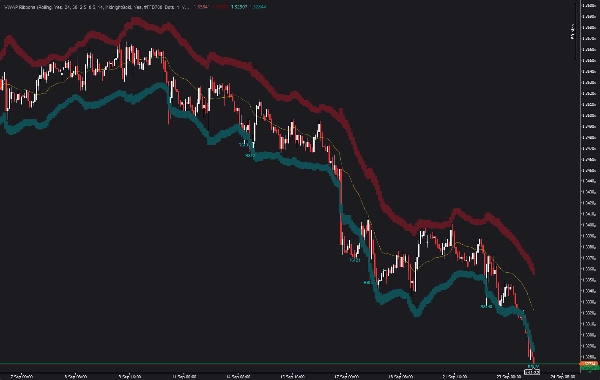
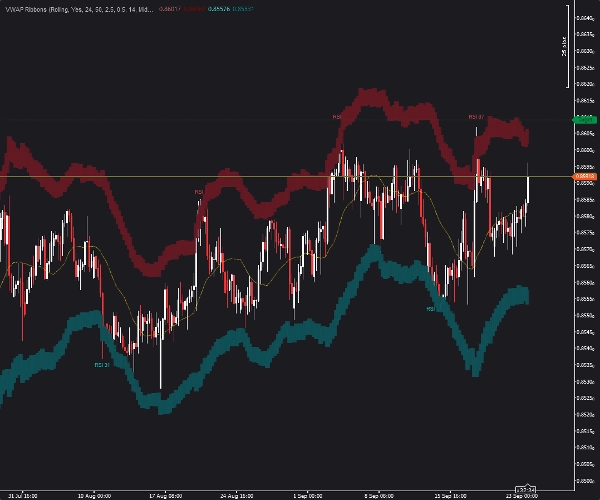
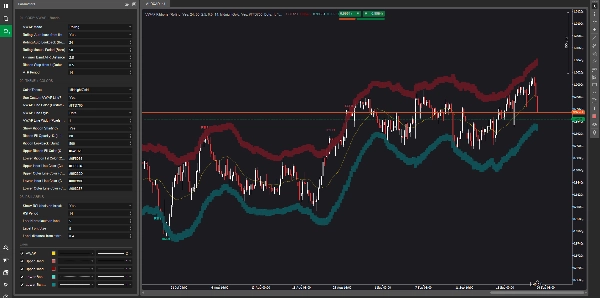
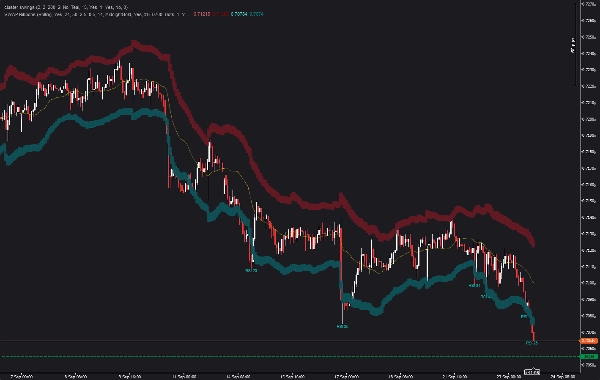
VWAP + 双层 ATR 缎带带有 RSI 标签,显示突破极值 — cTrader 上的实时逐笔形成标签

VWAP 缎带是一个 cTrader 指标,绘制滚动或每日成交量加权平均价格基线,周围环绕双层 ATR 波动率缎带,并自动在每个完成的突破极值处标注 RSI 值 — 包括一个实时标签,随着价格推动到新极值时在当前形成的柱上更新。

为希望在 VWAP 周围获得清晰波动率背景且无杂乱的交易者设计,同时提供价格超出外层缎带的确切柱上的 RSI 背景。

cTrader 原生 • 完成柱无重绘 • 实时逐笔形成标签 • 五种主题预设

指标功能

VWAP 缎带回答了一个核心问题:

价格相对于成交量加权的公平价值处于何处 — 当前走势拉伸程度如何?

指标显示:

  • VWAP 基线(滚动窗口或每日重置)
  • 内层 ATR 缎带(k 倍数)
  • 外层 ATR 缎带(k + 步长倍数)
  • 内外缎带之间的可选缎带阴影
  • 每个完成的突破极值处的 RSI 标签
  • 跟踪当前形成突破的实时 RSI 标签

突破定义为任何高点触及或超过外层上缎带(或低点触及/超过外层下缎带)的柱,标签锚定于该波动的极值柱— 不是进场或出场柱。

核心组成部分

VWAP 基线
提供两种模式:

  • 滚动窗口 — 持续更新过去 N 根柱的 VWAP。自动模式根据您的时间框架推导柱数(默认24小时数据)。手动模式允许您直接指定柱数。
  • 每日重置 — VWAP 在每个交易日开始时重置。

双层 ATR 缎带
使用平均真实波幅(Wilder 平滑以匹配 MetaTrader)绘制围绕 VWAP 基线的内外波动率缎带。内层缎带位于k × ATR;外层缎带位于(k + step) × ATR。缎带随波动率自然扩展和收缩。

缎带阴影
内外缎带之间的可选半透明填充,形成视觉通道。透明度可配置。缎带绘制受回溯限制,以保持长历史上的性能流畅。

完成突破处的 RSI 标签
每个完成的突破极值都会获得一个 RSI 标签。标签锚定于极值柱的高点(上突破)或低点(下突破),偏移量为可配置的 ATR 距离。标签显示该柱的 RSI 值。

实时形成的突破标签
专用实时标签实时跟踪当前形成柱的突破波动。随着价格在形成的蜡烛上推动到新极值,标签跟随。当柱收盘时,实时标签转变为确认的突破标签列表。

工作原理

  1. VWAP 根据所选回溯期计算,使用典型价格 × 成交量 ÷ 总成交量。累积和数组确保每根柱的计算成本为常数 O(1),无论窗口大小。
  2. ATR(Wilder 平滑)根据配置周期计算。内外缎带分别绘制在k和k + step倍数的 VWAP 基线上下方。
  3. 状态机跟踪上下波动:
    • 当价格触及或超过外层缎带时,波动开始。
    • 随着价格进一步推动,极值柱和极值价格更新。
    • 当价格收盘回到内层缎带内时,波动结束。
    • 极值柱被记录为完成的突破。
  4. 每个完成突破的极值柱上绘制 RSI 标签。
  5. 当前形成柱上维护一个实时标签,逐笔更新直到柱收盘。

图表上显示内容

  • VWAP 线(自定义颜色、样式和像素宽度)
  • 四条缎带边界线(内层虚线,外层实线 — 上下)
  • 内外缎带之间的可选缎带阴影
  • 上突破极值上方的 RSI 标签(显示该柱的 RSI)
  • 下突破极值下方的 RSI 标签(显示该柱的 RSI)
  • 跟踪当前形成突破的实时 RSI 标签

五种主题预设:
午夜金 · 霓虹 · 海洋 · 轻量图表 · 自定义

历史、实时及无重绘行为

所有完成的突破计算仅使用已收盘的柱。一旦柱收盘且突破极值被记录,标签不再改变。

实时形成的突破标签随着当前柱的发展逐笔更新 — 这是一个临时读数,直到柱收盘才最终确定。柱收盘时,波动要么被确认作为完成突破(并放置永久标签),要么如果价格回到内层缎带内则被放弃。

实时标签在视觉上与完成标签相同,但始终反映形成柱的当前状态。

参数架构

01. 核心 — VWAP + 缎带
VWAP 模式(滚动 / 每日)· 滚动自动(时间框架柱数)· 滚动自动回溯(小时)· 滚动手动周期(柱数)· k — 内层缎带 ATR 距离 · 缎带步长 · ATR 周期

02. 主题 + 颜色
主题预设 · 自定义 VWAP 线开关 · VWAP 线颜色 · VWAP 线样式 · VWAP 线宽度 · 缎带阴影开关 · 缎带填充透明度 · 缎带回溯柱数 · 上/下缎带填充颜色 · 上内/外/下内/外线颜色

03. RSI 标签
显示 RSI 标签 · RSI 周期 · 标注的最近 N 次突破 · 标签字体大小 · 标签距离极值(× ATR)

实际市场场景

价格突破外层缎带后回落收盘
价格突破内外上缎带,创出新高。RSI 标签放置在该极值柱,显示最大拉伸时的 RSI 读数。如果 RSI 超过 70,标签视觉上标记外层缎带的超买波动。

多次突破的持续趋势
价格多根柱缓慢上升,多次突破外层缎带。每个新极值且收盘回到内层缎带内的波动被记录为独立突破事件,并带有自己的 RSI 标签。标签群快速显示 RSI 在连续推动中的上升、平稳或背离。

实时形成突破
价格当前压在外层上缎带。实时 RSI 标签跟踪当前形成柱的极值。随着柱发展,标签逐笔更新。柱收盘回到内层缎带内时,标签转为永久完成突破标签。

缎带压缩与扩展
缎带宽度在趋势移动时扩展,在平静期收缩。缎带变窄时,价格触及外层缎带后通常快速回到内层缎带内 — 表示浅层波动。缎带变宽时,波动往往持续更长。

兼容性

  • 平台:cTrader(cAlgo API)
  • 资产类别:外汇,含 XAUUSD 的贵金属,含 US30、NAS100 和 GER40 的指数,大宗商品及加密货币工具
  • 时间框架:M5、M15、H1、H4、每日
  • 成交量数据:经纪商提供的逐笔成交量
  • 依赖项:无。原生 cAlgo,无外部库

技术说明

该指标完全用 cAlgo(C#)编写。滚动 VWAP 使用累积和数组 — 每根柱的计算成本保持恒定,无论窗口长度。所有完成的突破逻辑均使用已收盘柱数据。

突破状态机跟踪最高高点(上波动)或最低低点(下波动),只要价格保持在外层缎带之外。记录的极值柱是波动达到最大值的柱 — 不是进场或出场柱。

实时形成的标签作为图表文本对象绘制,每个极值时间戳有唯一名称,确保平滑更新且无对象频繁变动。完成的标签在超出“最近 N 次”窗口时自动跟踪并清理。

缎带填充使用带自动垂直连接器的矩形图表对象,确保柱间无缝阴影。

此指标适合谁?

VWAP 缎带适合希望获得:

  • 清晰的 VWAP 参考及波动率背景
  • 基于 ATR 的可见缎带用于拉伸分析
  • 最大价格拉伸确切柱的 RSI 读数
  • 实时跟踪当前形成的突破
  • 可配置缎带回溯,图表杂乱最小化

可与涉及价格行为、成交量分析、均值回归或趋势延续的更广泛方法论一起使用。

该指标提供分析可视化 — 不是买卖信号。

购买

VWAP 缎带可通过 cTrader 商店获得。购买包含终身访问权限、五种主题预设及开发者直接支持。

VWAP 缎带 — cTrader VWAP 指标 | 滚动 VWAP | 每日 VWAP | ATR 缎带 | ATR 缎带 | VWAP 缎带 | RSI 标签 | 突破标签 | 实时形成标签 | cTrader 指标 | cAlgo 指标 | 无重绘信号 | 成交量加权平均价 | XAUUSD 指标 | US30 指标 | NAS100 指标 | 均值回归 | 波动率缎带 | 超买超卖


摘要

AI 摘要
VWAP Ribbons is a cTrader indicator that visualizes price relative to volume-weighted average price (VWAP) with volatility context and momentum insights. It plots a VWAP baseline—either rolling over a specified window or resetting daily—surrounded by dual-layer Average True Range (ATR) bands representing inner and outer volatility thresholds. The indicator highlights breakout extremes where price touches or exceeds the outer ATR bands and automatically labels these bars with their corresponding Relative Strength Index (RSI) values. A live RSI label tracks the currently forming breakout bar in real time, updating tick-by-tick until the bar closes.

Key features include customizable VWAP modes, ATR band multipliers, optional shaded ribbons between bands, and configurable RSI label display. Breakouts are identified by excursions beyond the outer bands that close back inside the inner bands, with labels anchored to the extreme bar of each breakout. The indicator supports multiple timeframes (M5 to Daily) and asset classes including Forex, metals (e.g., XAUUSD), indices (e.g., US30, NAS100), commodities, and cryptocurrencies, using broker-supplied tick volume data.

VWAP Ribbons is designed for traders seeking clear volatility and momentum context around VWAP with minimal chart clutter. It provides analytical visualization without generating buy or sell signals. Five theme presets and extensive customization options are included.
指标配置
指标分类
交易量
输出类型
信号
过滤器
可视化
数据要求
仅 K 线
跳动点数据
交易量
支持的信号
交叉
背离
突破
反转
趋势强度
波动性
触及水平位
突破水平位

讨论

客户评价

4.7
评价:4
5
75 %
4
25 %
3
0 %
2
0 %
1
0 %
客户评价
October 29, 2026
Finally, a VWAP layout with something more useful than arrow overload. Two ATR layers show extension while RSI labels add momentum context. The 24 hour Auto window gives the ribbon a clear reference, with forming candle labels kept distinct from settled readings.
October 23, 2026
Putting momentum beside price's distance from VWAP is a well judged combination. The inner and outer ATR layers make the extension visible at a glance. It offers a clear way to study stretched moves without needing every observation turned into another buy or sell arrow.
October 22, 2026
VWAP distance and RSI make a sensible pairing for stretched moves, with 2 ATR layers providing context while live labels remain changeable until the bar closes.
October 11, 2026
Tested on EURUSD and XAUUSD across H1 and M1. Rolling VWAP, dual ATR ribbons, shading and RSI labels rendered correctly and remained stable across different market scales. The ribbon provides clear volatility context around VWAP without excessive clutter, while RSI labels add useful context at price extremes. No visible functional issues were found.

常见问答

RSI
Volume
Channel
ATR
VWAP
Support & Resistance
cTrader Store 提供的所有产品,包括交易机器人、指标和插件,均由第三方开发者提供,仅供信息参考和技术访问之用。cTrader Store 并非经纪商,不提供投资建议、个人推荐或任何未来业绩保证。

该作者的其他作品

指标
ATR
RSI
+5
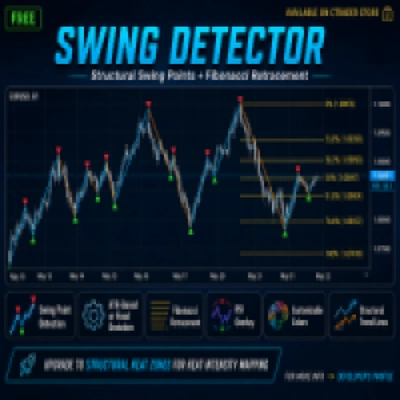
Free swing detector with Fibonacci retracement and RSI overlay. Auto-deviation adapts to any timeframe
指标
Volume
Imbalance
+1
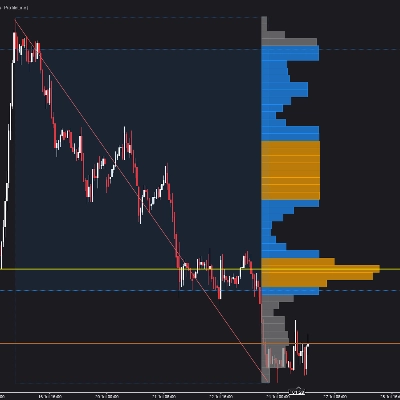
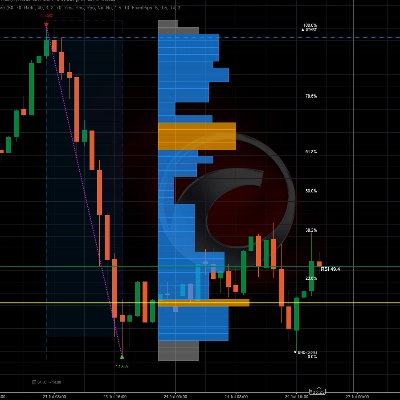
Volume profile indicator that auto-detects the latest trendline. Shows POC, Value Area (VAH/VAL), and High Volume Nodes
指标
ATR
BOS
+5
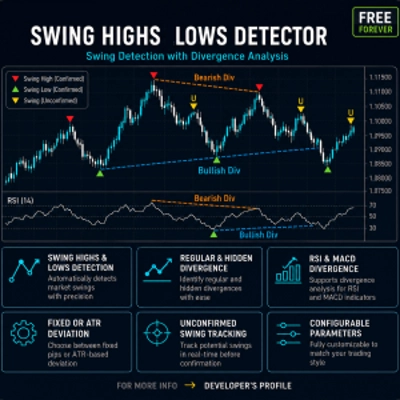
Auto Swing detection with regular and hidden divergence analysis. RSI and MACD divergence detection.
指标
BOS
Flag
+5
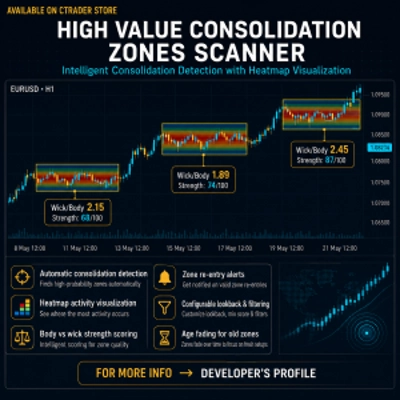
Detect consolidation zones. Heatmap shows activity density. Body vs wick scoring reveals true strength zones.
指标
ATR
EMA
+5
Multi-factor volatility squeeze detector, dual-trend scoring & breakout validation dashboard. No repaint.
指标
EMA
Channel
+3
Real-time squeeze detection, dual-horizon trend scoring & institutional breakout validation HUD dashboard.
指标
ATR
RSI
+5
Multi-factor VWAP mean-reversion signals with ATR bands, volume exhaustion, and RSI gate on cTrader.
指标
MSS
Volume
+3
Rejection-based volume profile with tiered heat zones, POC levels and a fully draggable anchor on cTrader.
cBot
ATR
Wedge
+5
15 YEARS RESULTS :Win rate:93% | ROI+19000% | Trades:87,000 | Profit Factor 1.2 | Currency Pairs:22 | $10k to 500k$ |
1.2
盈利系数
指标
MSS
VWAP
+5
VWAP mean-reversion signals combined with a ribbon-anchored volume profile, VAH/VAL, POC and HVN levels.
指标
ATR
BOS
+5
Heat intensity mapping of structural participation. See where price fights, where it accepts, and where it rejects .
指标
RSI
Volume
+3
Auto-detects swings, Includes POC, Value Area (VAH/VAL), High Volume Nodes (HVN), Fibonacci retracement, and RSI overlay

猜您喜欢

指标
Doji
Engulfing
+1
Mide en puntos la distancia entre el Máximo y el Mínimo alcanzados por cada vela, incluida la vela actual.
"ORB v1.1" 标识
人气
4.0
(4)
$25
指标
Breakout
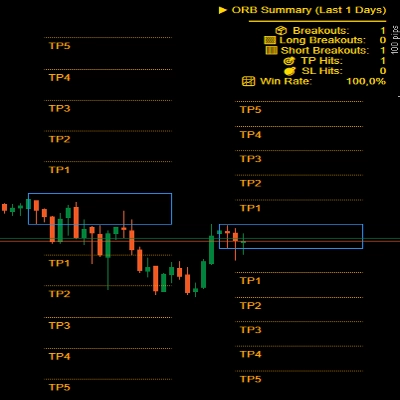
Opening Range Breakout v1.1 - Visuals + Stats
指标
ATR
RSI
+6
💹 Define a price channel 📈 and determine trend direction (bullish 🟢 or bearish 🔴).
指标
ATR
BOS
+5
Opening ranges, dynamic trend channels, and multi-scale breakout/retest analysis for clear intraday chart decisions.
指标
AI
ATR
+27
Trend Is Your Friend cBot - INDICATOR - Professional Grid, Pyramid, Swing & Scalp Trading Indicator
指标
ADX
ATR
+5
Configure, simulate, and analyze trading strategies with custom filters, multi-target exits, and detailed performance me
指标
Volume
Key Levels
Dynamic Visible Range Volume Profile for cTrader. Real-time POC, Value Area & Smart Alerts for precise trading.
指标
Prop
Forex
+5
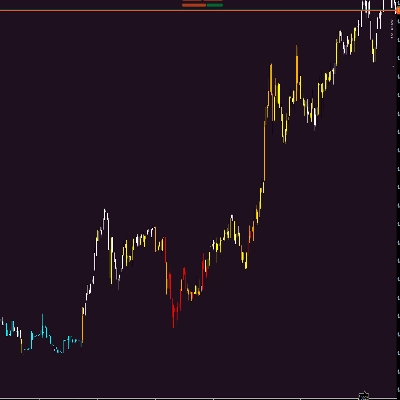
Color Volume Bars – Visualize Market Strength Instantly
指标
Advanced customizable volume-profile indicator with buy/sell levels, delta analysis, multi-TF support and vivid gradient
指标
VWAP
Support & Resistance
Trading.FC$_vwap Algo shows VWAP trends, dynamic support/resistance and deviation bands to spot potential trade entries.
指标
AI
ATR
+10
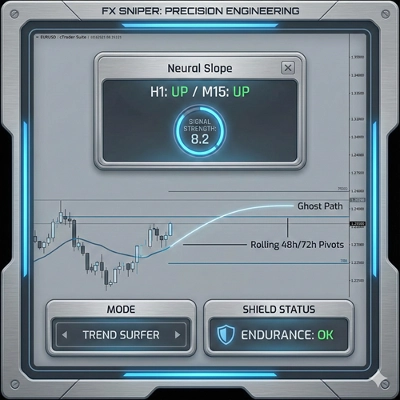
FX Sniper: Multi-pair Forex analysis tool. Features trend logic, adaptive pivots, and momentum filtering for major pairs
指标
Parabolic SAR Alert - Trend reversal alerts with smart signals & custom alerts.
指标
SMC
Prop
+13
Tracks virgin levels. Lines vanish only after a candle closes beyond the high/low on your chosen timeframe.
指标
Prop
Forex
+13
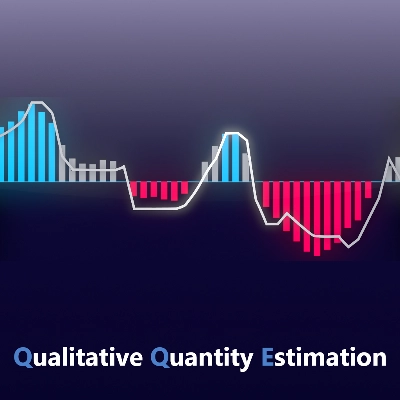
Unlock trading precision with QQE! Dual QQE indicators with a Bollinger Bands zero line provide clear buy/sell signals.
指标
Volume
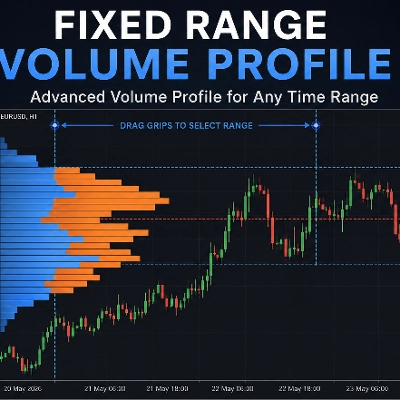
Fixed Range Volume Profile
指标
SMC
Prop
+15
Auto-detects Swing Highs/Lows to draw dynamic Support & Resistance levels with break tracking.
指标
Imbalance
Key Levels
+5
Smart Money Concepts (SMC) indicator with real-time Fair Value Gap (FVG) boxes, $50 round numbers, and live market HUD.

价格

注册日期 14/01/2025
5
销售
424
免费安装