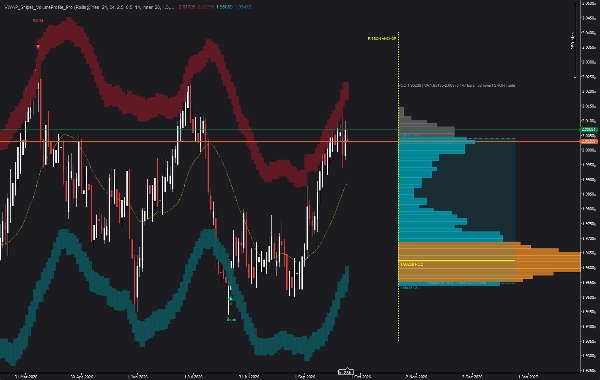
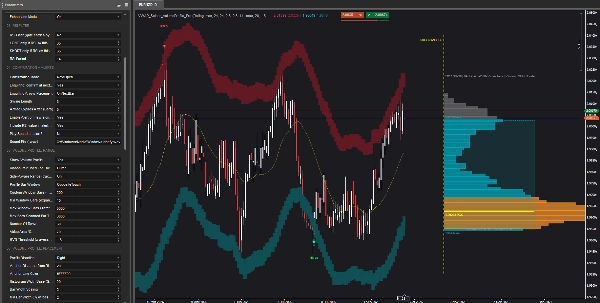
Description
DESCRIPTION COMPLÈTE
VWAP Sniper Volume Profile Pro
Indicateur de profil de volume cTrader — VWAP roulant, ruban ATR à double couche, profil de volume avec VAH/VAL/POC/HVN, signaux de retournement multifactoriels et ancre déplaçable
VWAP Sniper Volume Profile Pro combine deux couches analytiques dans un seul indicateur cTrader : un moteur de signal de moyenne de réversion VWAP multifactoriel et un profil de volume ancré au ruban qui cartographie exactement où le volume s'est concentré à l'intérieur de la plage du ruban.
Le côté signal identifie les configurations potentielles de retournement aux extrêmes statistiques des prix en utilisant le VWAP roulant, les bandes ATR à double couche, l'épuisement du volume, le rejet de mèche et une porte RSI. Le côté profil montre où le prix a réellement été échangé à l'intérieur de cette plage de ruban — avec le Point de Contrôle, la Zone de Valeur et les Nœuds de Volume Élevé mis en évidence.
Les deux couches partagent la même ligne de base VWAP et le ruban ATR — donc la plage du profil est toujours la même plage qui a produit le signal.
Natif cTrader • Pas de repeinture sur les barres fermées • Ancre de profil déplaçable • Cinq préréglages de thème
Ce que fait l'indicateur
VWAP Sniper Volume Profile Pro répond à deux questions liées :
- Où le prix s'est-il étiré au-delà de sa juste valeur pondérée par le volume récente, avec le volume et le momentum confirmant l'épuisement ? — le moteur de signal.
- À l'intérieur de cette plage étirée, où le volume s'est-il réellement concentré — et où se trouve le Point de Contrôle ? — le moteur de profil de volume.
Le moteur de signal évalue quatre conditions indépendantes sur chaque barre terminée et n'arme un signal que lorsqu'elles s'alignent : pénétration du prix d'une bande ATR ancrée au VWAP, expansion du volume de ticks, structure de rejet de chandelier, et épuisement du momentum RSI.
Le moteur de profil de volume construit ensuite une distribution barre par barre du volume de ticks à travers la plage du ruban, identifie le POC (Point de Contrôle), la Zone de Valeur (VAH/VAL — la bande la plus étroite contenant un pourcentage configurable du volume), et les Nœuds de Volume Élevé (HVN — bacs au-dessus d'un multiple configurable de la moyenne).
Composants principaux
Ligne de base VWAP roulante
Prix moyen pondéré par le volume continuellement mis à jour sur une fenêtre roulante configurable. Le mode automatique dérive le nombre de barres de votre unité de temps (par défaut 24 heures). Le mode manuel vous permet de spécifier directement le nombre de barres. Le mode réinitialisation quotidienne est également disponible pour un VWAP basé sur la session.
Ruban ATR à double couche
Bandes de volatilité intérieure et extérieure tracées autour de la ligne de base VWAP utilisant l'ATR (lissage de Wilder). Bande intérieure à k × ATR, extérieure à (k + step) × ATR. Choisissez votre déclencheur d'étirement : bande intérieure, bande extérieure ou à l'intérieur du ruban.
Filtres d'épuisement de volume et de mèche
Compare le volume de ticks actuel à une moyenne mobile de volume configurable. Évalue la structure du chandelier pour les mèches de rejet ou les motifs d'englobement. Choisissez le mode d'épuisement : Volume OU Action de Prix, Volume ET Action de Prix, Volume uniquement, ou Action de Prix uniquement.
Filtre de porte RSI
Optionnel. Bloque les signaux longs au-dessus d'un seuil RSI configurable (par défaut 35) et les signaux courts en dessous d'un seuil configurable (par défaut 65).
Modes de confirmation
Quatre méthodes de confirmation :
- Rupture de haut/bas d'épuisement
- Rupture de swing
- L'un ou l'autre (Exh ou Swing)
- Ouverture de la barre suivante (agressif)
Les motifs d'englobement peuvent confirmer instantanément à l'ouverture de la barre suivante — aucune rupture requise.
Profil de volume ancré au ruban
Un profil de volume complet construit à l'intérieur de la plage du ruban. Le profil répond à une question différente de celle du signal : où, à l'intérieur de cette plage étirée, le prix a-t-il réellement passé du temps et du volume ?
Point de Contrôle (POC)
Le niveau de prix avec le volume échangé le plus élevé à l'intérieur de la fenêtre de profil. Dessiné comme une ligne horizontale solide avec une étiquette de prix.
Zone de Valeur (VAH + VAL)
La bande la plus étroite contenant un pourcentage configurable du volume total du profil (par défaut : 70%). Dessinée comme deux lignes pointillées avec des étiquettes de prix, plus une bande optionnelle faible entre elles.
Nœuds de Volume Élevé (HVN)
Lignes de profil dont le volume dépasse un multiple configurable du volume moyen des lignes (par défaut : 1,5×). Dessinées dans une couleur de surbrillance distincte.
Ancre de profil déplaçable
La ligne d'ancrage du profil est entièrement déplaçable. Saisissez-la et déposez-la — le profil se redessine autour du nouvel offset de barre. L'offset est stocké comme une distance signée en barres depuis la barre en direct, donc il reste fixe à mesure que de nouvelles barres arrivent.
Fenêtre de barres du profil
Quatre modes de fenêtre :
- Toucher opposé — du dernier toucher de bande opposée jusqu'à maintenant (par défaut)
- Fenêtre VWAP — même fenêtre que le calcul VWAP
- Quotidien — session quotidienne en cours uniquement
- Barres personnalisées — dernières N barres
Plage consciente du côté
Lorsqu'activée, la plage du profil suit le dernier toucher de bande du côté opposé :
- Sur une configuration LONGUE (prix étiré en dessous) : plage du profil = Lower2 → dernier toucher Upper2
- Sur une configuration COURTE (prix étiré au-dessus) : plage du profil = Upper2 → dernier toucher Lower2
Cela signifie que le profil couvre toujours la plage complète du mouvement étiré actuel, pas seulement la barre en cours.
Comment ça fonctionne
Côté signal
- Le VWAP roulant est calculé sur la période sélectionnée en utilisant le prix typique × volume ÷ volume total. Les tableaux de somme cumulative fournissent un coût exact O(1) par barre quelle que soit la taille de la fenêtre.
- L'ATR (lissage de Wilder) est calculé. Les bandes intérieure et extérieure sont tracées à
ketk + stepmultiples au-dessus et en dessous de la ligne de base VWAP. - Pour chaque barre terminée, le moteur vérifie si le prix a pénétré la bande déclencheuse sélectionnée, évalue le volume de ticks par rapport à la moyenne mobile de volume, et teste si le chandelier forme une mèche de rejet ou un motif d'englobement.
- Si toutes les conditions s'alignent, un point armé est placé et le niveau d'épuisement est enregistré.
- Une fois la condition de confirmation remplie sur une barre ultérieure, la flèche de signal est imprimée et verrouillée. L'état armé expire après un nombre configurable de barres.
Côté profil
- La fenêtre de profil est déterminée par le mode de fenêtre sélectionné (par défaut : du dernier toucher de bande opposée jusqu'à maintenant).
- La plage de prix est divisée en un nombre configurable de lignes (par défaut : 60). Chaque ligne représente une tranche horizontale de prix.
- Chaque barre dans la fenêtre est parcourue : son volume de ticks est distribué à travers les lignes que sa plage haut-bas couvre (les barres entièrement contenues créditent directement la ligne ; les barres couvrant plusieurs lignes répartissent le volume uniformément).
- Le POC est identifié comme la ligne avec le volume le plus élevé. La Zone de Valeur est calculée en utilisant la méthode standard "expansion à partir du POC vers l'extérieur" jusqu'à atteindre le pourcentage configuré. Les lignes HVN sont signalées lorsque le volume dépasse le multiple seuil.
- Le profil est dessiné sous forme de barres horizontales ancrées à la ligne d'ancrage déplaçable — s'étendant vers la gauche ou la droite selon votre réglage de direction.
Ce que vous voyez sur le graphique
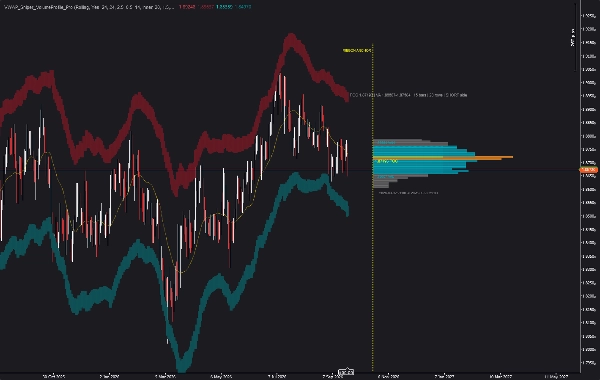
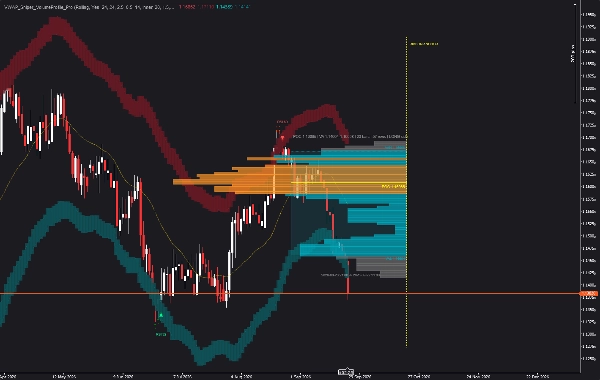
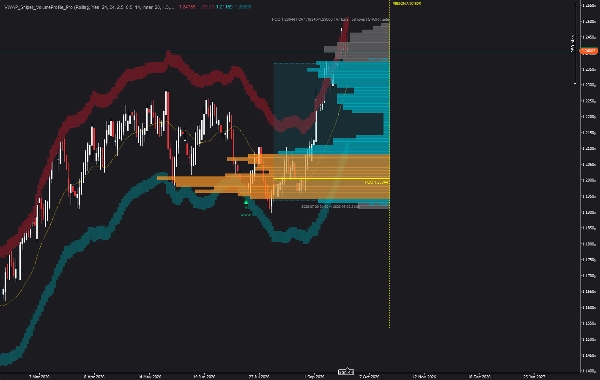
Couche de signal :
- Ligne VWAP dorée
- Quatre lignes de limite de bande (intérieure pointillée, extérieure solide)
- Ombre optionnelle du ruban entre les bandes intérieure et extérieure
- Flèches de signal LONG vertes avec halo doux en dessous
- Flèches de signal SHORT rouges avec halo doux en dessous
- Points armés sur les chandeliers d'épuisement
- Étiquettes de texte RSI optionnelles aux extrêmes récents du signal
Couche de profil :
- Barres d'histogramme horizontales à travers la plage du profil
- Ligne POC solide jaune avec étiquette de prix
- Lignes VAH et VAL bleues en pointillés avec étiquettes de prix
- Lignes HVN orange (nœuds de volume mis en évidence)
- Lignes à faible volume grises
- Bande de zone de valeur faible optionnelle entre VAH et VAL
- Ligne d'ancrage jaune déplaçable (étiquetée "RIBBON ANCHOR")
- Étiquette d'information affichant POC, plage VA, barres, lignes, et côté
Cinq préréglages de thème :
Midnight Gold · Neon · Ocean · Light Chart · Custom
Comportement historique, en direct et sans repeinture
Toutes les flèches de signal, points armés et étiquettes RSI sont calculés sur des barres terminées. Une fois qu'une barre se ferme et qu'un signal est confirmé, le marqueur est verrouillé et ne change pas.
Le profil utilise uniquement les données des barres fermées dans son mode de fenêtre par défaut. La barre en formation actuelle n'est pas comptée dans le profil tant qu'elle n'est pas fermée. Cela signifie que les lignes POC, VAH, VAL et HVN ne bougent pas intra-barre ; elles se mettent à jour une fois par barre fermée.
La barre en formation en direct peut afficher un point armé provisoire ou un ruban mis à jour sur la bougie actuelle — ces lectures ne sont pas finales tant que la barre ne se ferme pas.
Cas d'utilisation 1 — Réversion VWAP avec confluence POC
Configuration : Le prix s'est étiré en dessous du ruban extérieur inférieur sur H1 XAUUSD, imprimant une mèche de rejet. Un point armé apparaît. Le RSI est à 28. Un signal LONG se déclenche à l'ouverture de la barre suivante.
Où le profil aide : Le profil de volume montre que pendant la fenêtre étirée, la ligne de volume la plus lourde (POC) se trouve au-dessus du prix actuel — près du milieu du ruban. Cela vous indique que la valeur acceptée par le marché pendant ce mouvement est au-dessus de l'extrême actuel, ce qui soutient une thèse de réversion vers la moyenne vers le POC.
Construction du trade : Entrée sur la flèche LONG confirmée. Stop sous le plus bas récent (sous le VAL si le VAL est proche du prix). Objectif au POC (ou à la ligne médiane du ruban si le POC est plus proche).
Pourquoi ça marche : Le signal VWAP a signalé l'extrême ; le profil vous a indiqué où le marché considérait la juste valeur pendant cet extrême. Les deux pointent dans la même direction.
Cas d'utilisation 2 — VAH et VAL comme objectifs de réversion
Configuration : Un signal SHORT se déclenche au ruban extérieur supérieur. Le profil montre une Zone de Valeur bien définie avec VAH à 4 825 et VAL à 4 760. Le prix actuel est 4 845 — au-dessus du VAH.
Où le profil aide : VAH et VAL sont statistiquement les limites où 70 % du volume de la session a été échangé. Lorsque le prix est en dehors de la Zone de Valeur et qu'un signal de retournement s'est déclenché, VAH (pour les shorts) ou VAL (pour les longs) devient la première cible naturelle — car c'est là que le marché a précédemment accepté le prix.
Construction du trade : Entrée sur la flèche SHORT confirmée. Stop au-dessus du plus haut récent. Objectif 1 au VAH (première réversion dans la Zone de Valeur). Objectif 2 au POC (pic de volume). Optionnel : runner vers VAL si le momentum est fort.
Pourquoi ça marche : La Zone de Valeur vous donne des objectifs structurés et basés sur les données au lieu de suppositions. VAH est le premier niveau où le prix est susceptible de faire une pause ; le POC est là où il est le plus susceptible de tenir.
Cas d'utilisation 3 — POC comme aimant lors de la consolidation
Configuration : Le prix a évolué entre les bandes intérieures du ruban pendant plusieurs barres. Aucun nouveau signal ne s'est déclenché, mais le profil montre un POC bien défini au milieu de la plage avec VAH/VAL symétriques de chaque côté.
Où le profil aide : Sur un marché en range, le POC agit comme un aimant — le prix a tendance statistique à revenir au niveau avec le volume échangé le plus élevé, car c'est là que la majorité des participants ont convenu de la valeur.
Construction du trade : Contrez les mouvements vers les bords de la Zone de Valeur, en ciblant le POC comme objectif de réversion vers la moyenne. Alternativement, utilisez le POC comme niveau de réentrée lors d'un pullback dans la direction de la tendance plus large.
Pourquoi ça marche : Vous tradez la valeur acceptée par le marché, pas une ligne tracée. Le POC est là où le plus de volume a réellement changé de mains — c'est pourquoi il agit souvent comme support/résistance dans les deux directions.
Cas d'utilisation 4 — Cassure de la Zone de Valeur avec confirmation HVN
Configuration : Le prix teste le VAH par le bas. Le profil montre qu'au-dessus du VAH, il y a un groupe dense de lignes HVN — le marché a échangé lourdement à ces niveaux à plusieurs reprises pendant la fenêtre de retour en arrière.
Où le profil aide : Les groupes HVN juste au-dessus de la Zone de Valeur sont un signe d'alerte pour les traders de cassure : le marché a déjà montré qu'il échangera lourdement à ces niveaux. Si le prix franchit le VAH mais reste bloqué au groupe HVN, la cassure est susceptible d'échouer.
Construction du trade : Si la tentative de cassure s'arrête à la première ligne HVN, envisagez de revenir dans la Zone de Valeur. Si le prix dépasse tout le groupe HVN avec un volume fort et clôture au-dessus, la cassure a un soutien structurel — le marché a accepté des prix plus élevés.
Pourquoi ça marche : Les niveaux HVN sont là où le plus de volume a changé de mains à un prix spécifique. HVN franchi = nouvelle valeur acceptée. HVN échoué = continuation improbable sans stimulus supplémentaire.
Cas d'utilisation 5 — Combinaison du signal VWAP avec le contexte du profil
Configuration : Deux signaux se déclenchent en quelques barres : un LONG à la bande extérieure inférieure, un SHORT à la bande extérieure supérieure. Sans contexte de profil, ces signaux semblent contradictoires.
Où le profil aide : Le profil montre que les deux signaux se sont déclenchés à l'intérieur de la même plage étirée — et que le POC est juste au milieu à la ligne médiane du ruban. Les deux signaux représentent le marché oscillant autour de la valeur acceptée, pas deux tendances opposées.
Construction du trade : Traitez cela comme un trade de range. Le signal inférieur cible le POC ; le signal supérieur cible le POC. Le côté qui échoue en premier (casse au-delà de la bande opposée) est la direction de la résolution éventuelle.
Pourquoi ça marche : Le profil révèle la structure interne du marché. Les signaux donnent le timing. Le profil vous dit si les signaux travaillent ensemble ou l'un contre l'autre.
Cas d'utilisation 6 — Ancre déplaçable pour analyse spécifique à une plage
Configuration : Vous souhaitez voir le profil de volume d'un mouvement historique spécifique — pas toute la fenêtre VWAP, et pas seulement le dernier toucher opposé.
Où le profil aide : Faites glisser la ligne d'ancrage jaune vers la barre où le mouvement d'intérêt a commencé. Le profil entier se reconstruit autour de la nouvelle ancre. Vous voyez maintenant le POC, VAH, VAL et HVN pour exactement la plage qui vous intéresse.
Construction du trade : Analysez la structure d'acceptation à l'intérieur de toute plage terminée ou en développement. Placez l'ancre à la base d'une impulsion précédente pour voir où le marché a accepté le prix pendant cette phase. Placez-la à un sommet de swing pour voir où les vendeurs dominaient.
Pourquoi ça marche : L'ancre est un offset signé en barres — elle reste fixe à mesure que de nouvelles barres arrivent, et elle est indépendante de la vue. Pas de ré-ancrage, pas de réinitialisation — juste glisser et analyser.
Architecture des paramètres
01. Noyau — VWAP + Bandes
Mode VWAP · Auto roulant (barres selon unité de temps) · Retour en arrière auto roulant (heures) · Période manuelle roulante (barres) · k — distance ATR bande intérieure · Pas du ruban à partir de k · Période ATR · Bande déclencheur d'étirement
02. Épuisement
Longueur MA volume · Multiplicateur de pic de volume · % min mèche de la plage · Plage min (× ATR) · Inclure englobant · Mode d'épuisement
03. Filtre RSI
Filtre RSI activé/désactivé · LONG uniquement si RSI ≤ · SHORT uniquement si RSI ≥ · Période RSI
04. Confirmation + Alertes
Mode de confirmation · Confirmation instantanée englobante · Placement flèche englobante · Longueur swing · Expiration armée après · Activer alerte · Inclure RSI dans texte alerte · Jouer son · Fichier son
05. Profil de volume : Plage
Afficher profil de volume · Paire de ruban utilisée pour la plage de prix · Plage consciente du côté · Fenêtre de barres du profil · Barres fenêtre personnalisées · Barres fenêtre min · Barres fenêtre max · Barres max scannées pour toucher opposé · Nombre de lignes · % Zone de Valeur · Seuil HVN
06. Profil de volume : Placement
Direction du profil · Distance d'ancrage depuis le ruban (barres) · Couleur ligne d'ancrage · Largeur base histogramme · Échelle largeur barre · Largeur barre min · Opacité barre % · Afficher barres + bande Zone de Valeur · Afficher ligne POC · Afficher nœuds de volume élevé · Afficher étiquette prix POC à l'ancre · Afficher étiquettes prix VAH/VAL · Afficher étiquette info · Afficher bordure plage · Recalculer à chaque tick · Couleur POC · Couleur Zone de Valeur · Couleur nœud de volume élevé · Couleur faible volume · Couleur info/étiquette · Taille police étiquette · Tolérance reconstruction
07. Thème + Couleurs
Préréglage thème · Ligne VWAP personnalisée · Couleur ligne VWAP · Style ligne VWAP · Largeur ligne VWAP · Ombre ruban · Opacité remplissage ruban · Retour en arrière ruban · Couleurs remplissage ruban supérieur/inférieur · Couleurs lignes intérieures/extérieures supérieur/inférieur
08. Marqueurs de signal
Afficher marqueurs visuels sur graphique · Afficher halo · Taille police flèche signal · Taille police halo · Couleurs noyau LONG/SHORT · Couleurs halo LONG/SHORT
09. Étiquettes RSI
Afficher étiquettes RSI · Nombre de signaux à étiqueter · Taille police étiquette · Distance étiquette de l'extrême (× ATR)
Compatibilité
- Plateforme : cTrader (API cAlgo)
- Classes d'actifs : Forex, métaux incluant XAUUSD, indices incluant US30, NAS100, et GER40, matières premières, et instruments crypto
- Unités de temps : M5, M15, H1, H4, Quotidien
- Données de volume : volume tick fourni par le courtier
- Dépendances : aucune. cAlgo natif, pas de bibliothèques externes
Notes techniques
L'indicateur est entièrement écrit en cAlgo (C#). Le VWAP roulant utilise des tableaux de somme cumulative — le coût par barre reste constant quelle que soit la longueur de la fenêtre. L'ATR utilise le lissage de Wilder.
Le profil de volume utilise des tampons de ligne et de bac réutilisables, donc les reconstructions répétées (lorsque le prix bouge ou que l'ancre est déplacée) n'entraînent aucune nouvelle collecte de déchets. Le calcul POC / VAH / VAL suit l'algorithme standard "expansion à partir du POC vers l'extérieur" utilisé par les outils professionnels de profil de volume.
Le remplissage du ruban utilise des objets rectangle de graphique avec des connecteurs verticaux automatiques pour un ombrage sans couture. Les objets ruban historiques sont remplis en arrière-plan sur un minuteur par blocs de 16 barres par tick — ainsi le profil, les signaux, et le ruban de la barre actuelle apparaissent immédiatement à l'attachement, et le ruban historique s'estompe derrière eux.
L'ancre déplaçable est un véritable objet de graphique cTrader — saisissez-la et déposez-la, et le dépôt se résout en un offset signé de barres depuis la barre en direct. La suppression de l'ancre (ou de son étiquette) provoque sa recréation automatique à la prochaine mise à jour du graphique. Pour réinitialiser à la distance par défaut, modifiez et réappliquez le paramètre "Distance d'ancrage depuis le ruban (barres)".
À qui s'adresse cet indicateur ?
VWAP Sniper Volume Profile Pro convient aux traders qui souhaitent :
- Entrées de réversion moyenne VWAP multifactorielle aux extrêmes statistiques
- Contexte de profil de volume pour la plage exacte qui a produit chaque signal
- Niveaux POC, VAH, VAL, et HVN calculés à partir du volume réel de ticks
- Objectifs de réversion structurés (VAH pour shorts, VAL pour longs, POC comme aimant)
- Ancre déplaçable pour analyse spécifique à une plage de tout mouvement historique
- Suivi de plage conscient du côté pour que le profil couvre toujours le mouvement étiré actuel
Utilisez-le en complément de méthodologies plus larges impliquant l'action des prix, la structure du marché, l'analyse du volume ou la recherche de continuation de tendance.
L'indicateur fournit des signaux analytiques basés sur la confluence — pas une garantie de direction future des prix.
Achat
VWAP Sniper Volume Profile Pro est disponible via le cTrader Store. Votre achat inclut un accès à vie, des alertes en temps réel avec télémétrie RSI, cinq préréglages de thème, une ancre de profil déplaçable, et un support direct du développeur.
VWAP Sniper Volume Profile Pro — Indicateur VWAP cTrader | VWAP roulant | Profil de volume | Indicateur POC | Zone de Valeur Haute | Zone de Valeur Basse | Indicateur VAH VAL | Nœud de volume élevé | Indicateur HVN | Bandes ATR | Épuisement de volume | Filtre RSI | Indicateur de réversion moyenne | Indicateur cTrader | Indicateur cAlgo | Signaux sans repeinture | Confluence multifactorielle | Indicateur XAUUSD | Indicateur US30 | Indicateur NAS100 | Réversion VWAP | Rejet de mèche | Confirmation englobante | Profil à ancre déplaçable
Résumé
The indicator features a rolling VWAP baseline with configurable lookback modes, inner and outer ATR volatility bands, and multiple confirmation methods for signals. The volume profile is built bar-by-bar within the ribbon range, with a draggable anchor allowing range-specific analysis. Profile windows can be set by opposite band touches, VWAP window, daily session, or custom bars. The profile range tracks the current stretched move for side-aware analysis.
Visual elements include VWAP and band lines, signal arrows, exhaustion dots, horizontal volume histograms, and labeled POC, VAH, VAL, and HVN levels. It supports Forex, metals (e.g., XAUUSD), indices (e.g., US30, NAS100), commodities, and crypto on timeframes from M5 to Daily, using broker-supplied tick volume. The indicator operates natively in cAlgo with non-repainting signals on closed bars and offers five theme presets.