present
Зарегистрируйтесь и получите скидку $50 на первую покупку
С 09/06/2026
4
Продажи

Описание

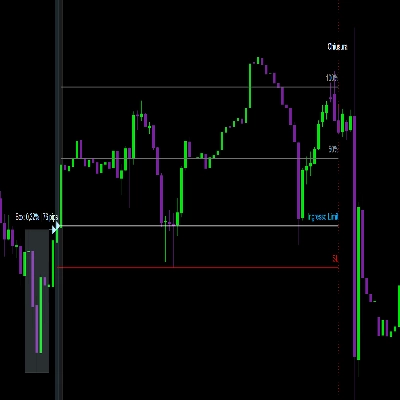
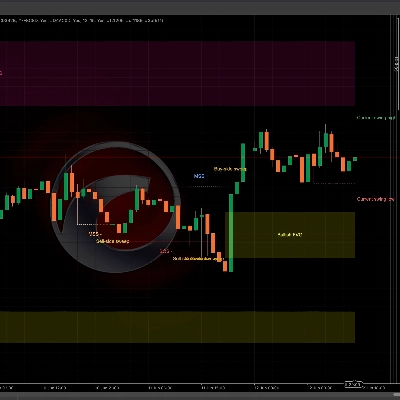
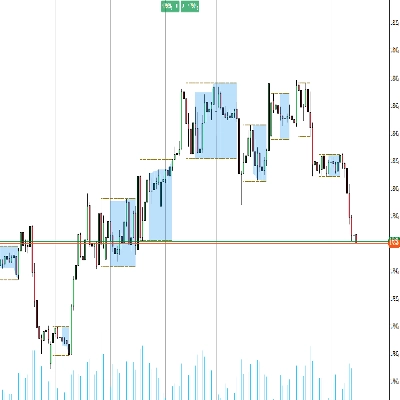
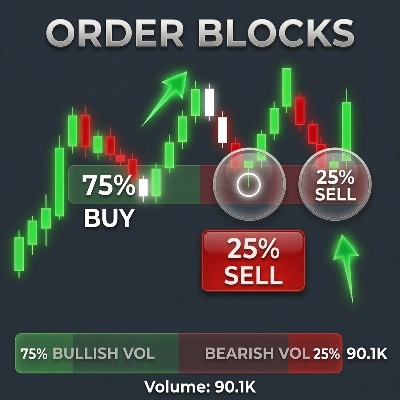
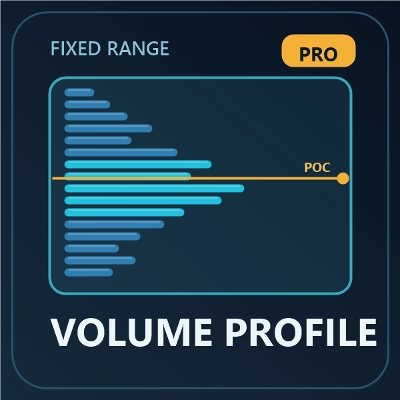
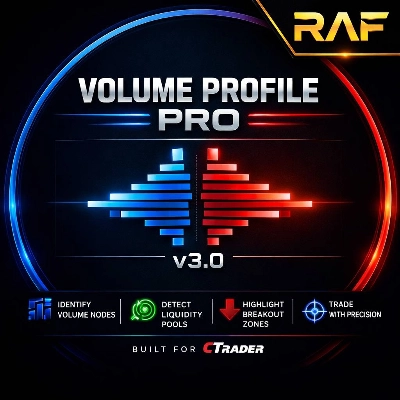
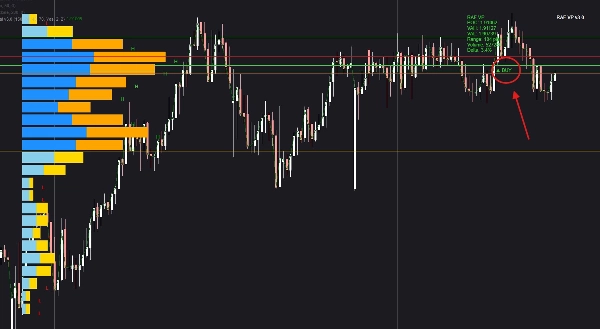
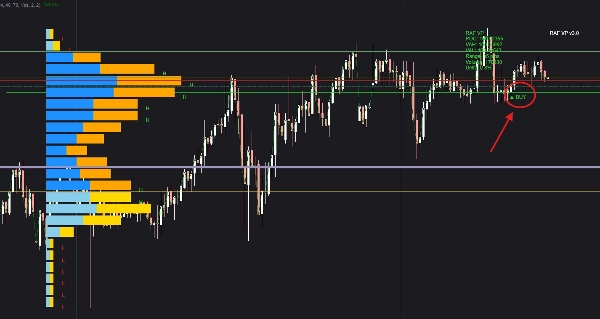
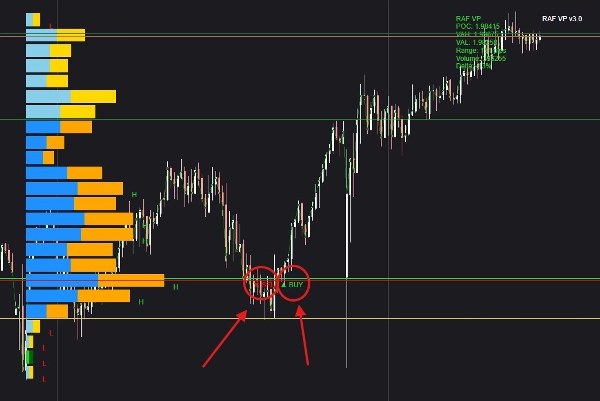
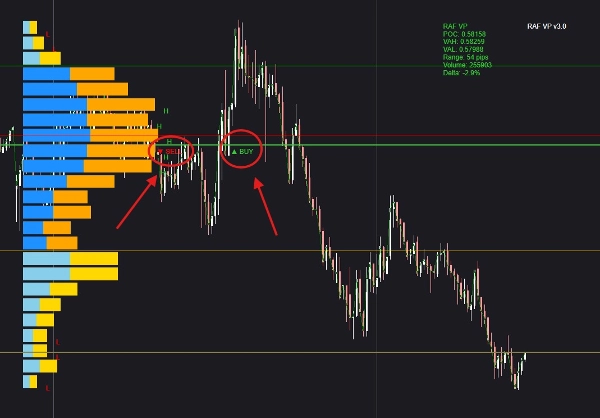
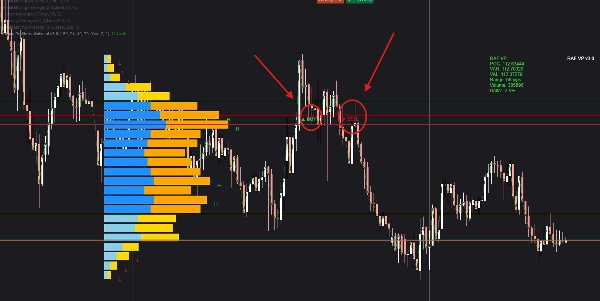
Он анализирует каждую свечу, чтобы определить, где сосредоточен торговый объем, выявляя реальные зоны активности институциональных трейдеров. Профиль объема в реальном времени показывает области HVN, где цена, вероятно, задержится, и области LVN, где она может быстро пробиться. Отслеживание дельты показывает, набирают ли силу покупатели или продавцы внутри каждой свечи. Когда цена взаимодействует с POC, зонами дисбаланса или ключевыми объемными полками, система оценивает поведение ордер-флоу и генерирует сигналы BUY или SELL на основе изменений в контроле рынка. Встроенное информационное окно отображает текущие значения POC, дельты, уровней объема и условий сигнала, чтобы трейдеры могли мгновенно видеть, почему формируется настройка и насколько она сильна. Это помогает с гораздо большей точностью, чем стандартные индикаторы, выявлять развороты, продолжения и высоковероятные входы.

Сводка

ИИ-сводка
Raf Volume Profile Pro v3.0 is an advanced volume-profile indicator designed to analyze each candle's trading volume distribution, highlighting zones of institutional activity. It identifies High Volume Nodes (HVN) where price tends to stall and Low Volume Nodes (LVN) where price can move rapidly. The tool tracks delta within candles to determine whether buyers or sellers are gaining strength. When price interacts with the Point of Control (POC), imbalance zones, or key volume shelves, the indicator assesses order flow and generates buy or sell signals based on shifts in market control. A built-in info window displays live POC, delta, volume levels, and signal conditions, providing real-time insight into the strength and formation of setups. This functionality supports identifying reversals, continuation patterns, and high-probability trade entries with greater precision than standard indicators. The product integrates concepts such as exponential moving averages (EMA), breaker blocks, key levels, imbalances, and support/resistance within its volume-based analysis framework. It outputs actionable signals including level touches, breaks, reversals, breakouts, and trend strength, relying on volume data as its primary input.
Профиль индикатора
Категория индикатора
Объем
Тип вывода
Сигналы
Требования к данным
Объем
Поддерживаемые сигналы
Касание уровня
Прорыв уровня
Сила тренда
Прорыв
Разворот

Обсуждение

Отзывы покупателей

5.0
Отзывы: 2
5
100 %
4
0 %
3
0 %
2
0 %
1
0 %
Отзывы покупателей
October 8, 2026
Profiles inside individual candles make delta, POC interactions and volume nodes easier to examine alongside the ordinary price shape. That's a strong visual analysis format, with imbalance interpretation still dependent on the actual feed and calculation method.
October 4, 2026
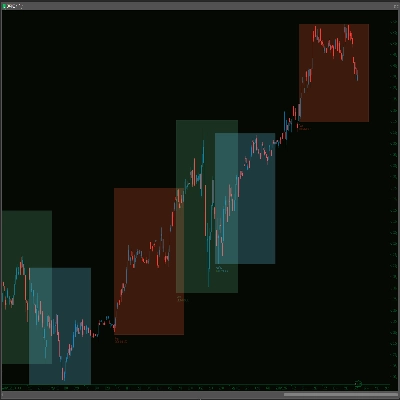
Raf Volume Profile Pro v3.0 provides clear volume histograms, POC and Value Area levels, Delta statistics, and BUY/SELL markers. Tested on EURUSD H1 and XAUUSD H1/M1, the indicator displayed consistently with a useful statistics panel. The layout is generally readable, although the profile can occupy part of the chart. A practical addition for discretionary volume analysis.

Частые вопросы

EMA
Breaker Block
Key Levels
Imbalance
Volume
Support & Resistance
Продукты, доступные в cTrader Store, включая торговых ботов, индикаторы и плагины, предоставляются сторонними разработчиками и доступны исключительно в информационных и технических целях. cTrader Store не является брокером и не предоставляет инвестиционные консультации, персональные рекомендации или какие-либо гарантии будущей доходности.

Цена

С 09/06/2026
4
Продажи