VIX - volatility indicator - Renko
指标
版本 1.0, Feb 2025
Windows 版、Mac 版
说明
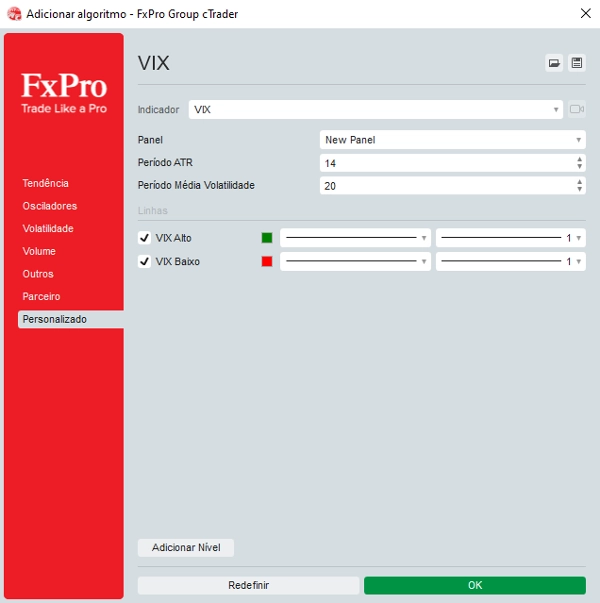
调整参数:输入 LowLevel 和 HighLevel 级别的期望值,并调整 VIX 缩放因子,使 VIX 线达到所需高度。
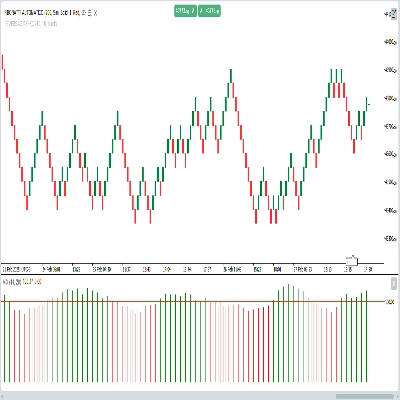
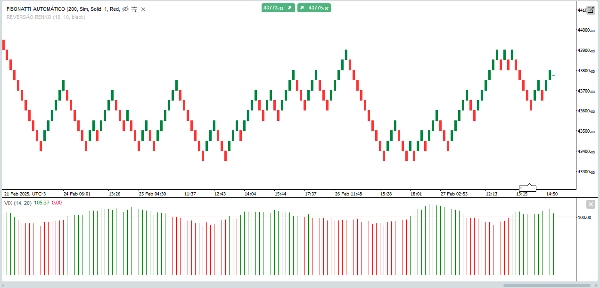
查看图表:
当 VIX 超过 HighLevel 且成交量高(绿色蜡烛)时,可以认为出现了突破。
当 VIX 低于 LowLevel 时,可能表示低波动期。
摘要
指标配置
客户评价
0.0
评价:0
客户评价
该产品尚无评价。已经试过了?抢先告诉其他人!
讨论
常见问答
Breakout
cTrader Store 提供的所有产品,包括交易机器人、指标和插件,均由第三方开发者提供,仅供信息参考和技术访问之用。cTrader Store 并非经纪商,不提供投资建议、个人推荐或任何未来业绩保证。
该作者的其他作品


猜您喜欢


价格
注册日期 05/02/2025
30
销售