
说明
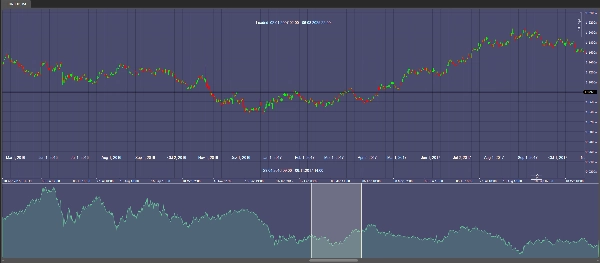
ChartOverview 让您全面了解市场的整个数据范围,从最早到最新可用的数据点。在图表顶部,您可以清晰地看到完整加载的时间范围,而当前可见的时间段则直接显示在图表上,提供实时洞察。
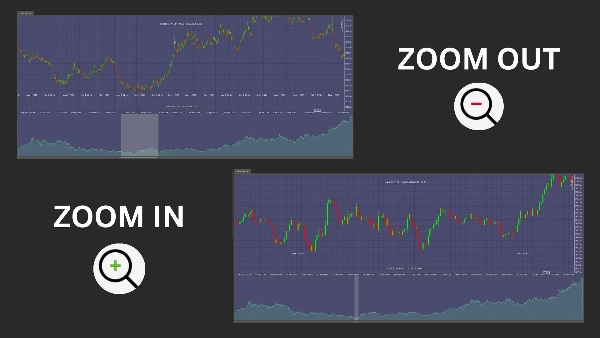
这个动态指标在您滚动、拖动或调整图表大小时无缝更新,确保您始终拥有最新信息。其直观的设计使您能够快速识别市场趋势和机会,增强您做出及时且明智交易决策的能力。
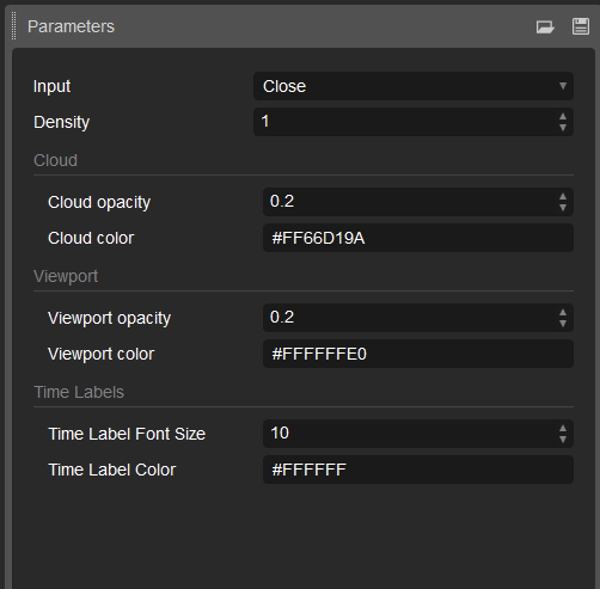
ChartOverview 提供丰富的颜色、不透明度和显示设置自定义选项,完美融入您的个人交易设置。利用这一旨在提供精准且全面市场概览的工具,提升您的分析能力,获得竞争优势。
摘要
AI 摘要
ChartOverview is a dynamic indicator designed to provide a comprehensive snapshot of market data across the entire loaded timeframe. It displays the full range of available data at the top of the chart, while highlighting the currently visible period directly on the chart for real-time analysis. The indicator updates automatically as users scroll, drag, or resize the chart, ensuring continuous access to the latest market information. Customization options include adjustments to colors, opacity, and display settings, allowing seamless integration into various trading setups. ChartOverview supports enhanced market trend identification and timely decision-making by delivering a clear and precise overview of market activity.
指标配置
客户评价
5.0
评价:1
5 | 100 % | |
4 | 0 % | |
3 | 0 % | |
2 | 0 % | |
1 | 0 % |
讨论
常见问答
cTrader Store 提供的所有产品,包括交易机器人、指标和插件,均由第三方开发者提供,仅供信息参考和技术访问之用。cTrader Store 并非经纪商,不提供投资建议、个人推荐或任何未来业绩保证。
该作者的其他作品


价格
注册日期 23/12/2024