Insider_CumulativeDelta
指标
820 下载
版本 1.0, Apr 2025
Windows 版、Mac 版
5.0
评价:1
说明
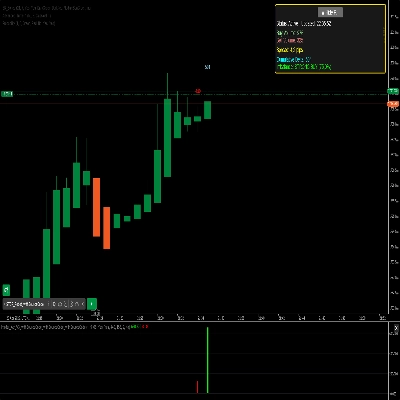
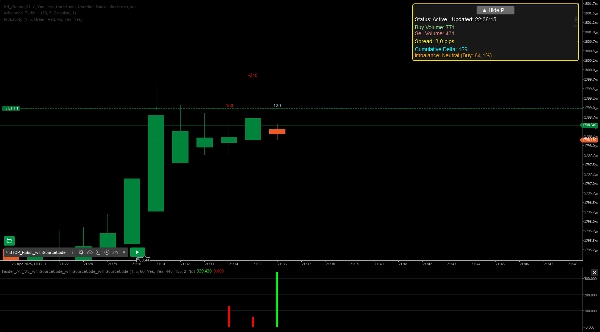
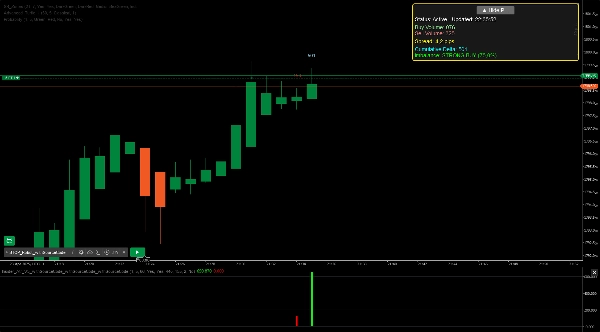
强大的累计增量和不平衡指标。
Insider 是一个强大的 cTrader 指标,旨在分析市场深度数据并实时突出买卖不平衡。它在图表上提供清晰的视觉反馈,通过直方图和可自定义的仪表板显示关键指标,如买/卖量、累计增量和不平衡强度。通过可调节的设置(包括显示周期、深度级别(1-10)和成交量不平衡阈值(50-95%))来定制您的交易风格。附加功能包括强不平衡的可选警报、交易时间过滤和可调整大小的面板以增强可用性。该指标非常适合日内交易者和波段交易者,提供有关市场情绪和潜在价格走势的宝贵见解。
摘要
指标配置
客户评价
5.0
评价:1
5 | 100 % | |
4 | 0 % | |
3 | 0 % | |
2 | 0 % | |
1 | 0 % |
客户评价
August 12, 2025
Pros: Accurate order flow insight, customizable display, valuable for intraday trading. Cons: No alerts, requires experience to interpret, no MTF mode.
讨论
常见问答
cTrader Store 提供的所有产品,包括交易机器人、指标和插件,均由第三方开发者提供,仅供信息参考和技术访问之用。cTrader Store 并非经纪商,不提供投资建议、个人推荐或任何未来业绩保证。
猜您喜欢


!["[Stellar Strategies] QQE" 标识](https://cdn.ctrader.com/image/webp/e702104a-874c-4b39-97dd-fb34518d1015_27712)


价格
注册日期 09/01/2025
11.78K
免费安装