
说明
高级市场时段指标,具有夏令时切换和每日、每周及每月功能,还包含ICT杀戮区和ICT银弹时间窗口等酷炫功能。
摘要
AI 摘要
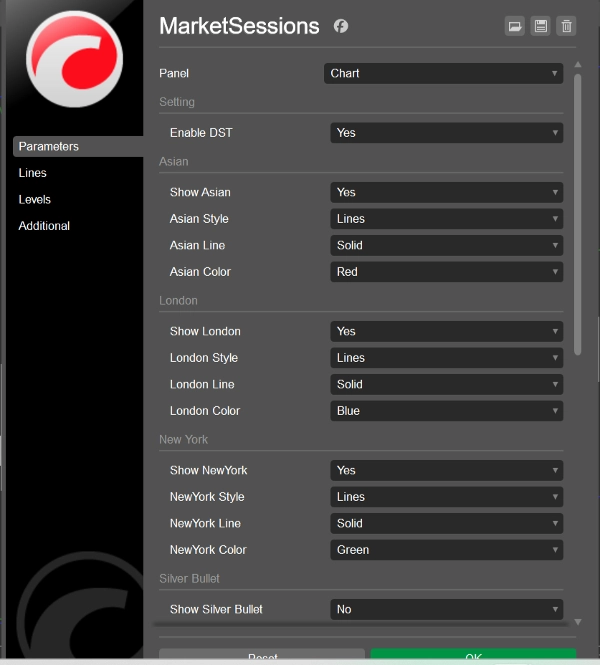
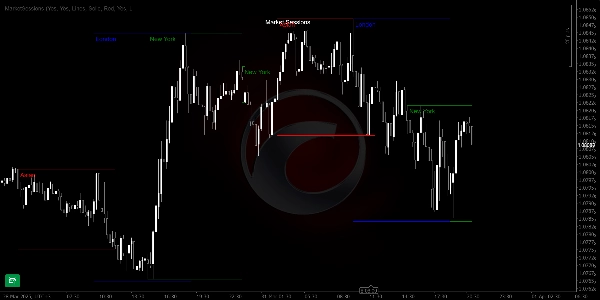
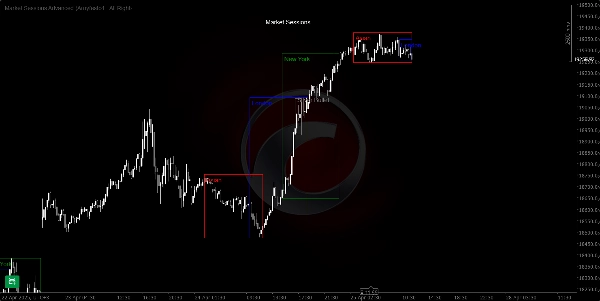
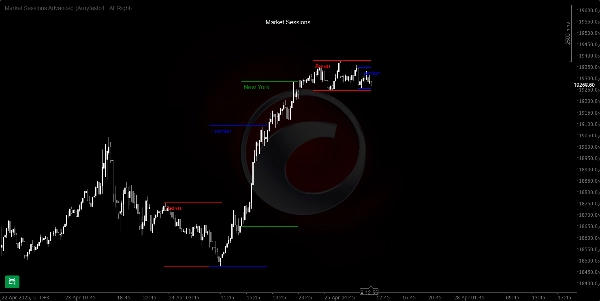
Market Sessions Advanced is an indicator designed for trading platforms that highlights market session times with enhanced features. It includes a daylight saving time (DST) toggle and displays daily, weekly, and monthly market sessions. The indicator incorporates ICT (Inner Circle Trader) Killzones and ICT SilverBullet time windows, which are specific time periods used by traders to identify potential market activity and trading opportunities. This tool supports analysis across multiple markets including forex, indices, commodities, cryptocurrencies, and stocks. It provides traders with a structured view of key trading sessions and time windows to assist in timing trades and market analysis.
指标配置
客户评价
5.0
评价:1
5 | 100 % | |
4 | 0 % | |
3 | 0 % | |
2 | 0 % | |
1 | 0 % |
客户评价
August 12, 2025
Pros: Displays Tokyo, London, and New York sessions with advanced settings including DST and overlap zones. Clean visual design ideal for trading session awareness. Cons: No tooltips or alerts. Cannot save user presets. Lacks session log or interaction beyond static display.
讨论
常见问答
Prop
Forex
Indices
Commodities
Crypto
Stocks
cTrader Store 提供的所有产品,包括交易机器人、指标和插件,均由第三方开发者提供,仅供信息参考和技术访问之用。cTrader Store 并非经纪商,不提供投资建议、个人推荐或任何未来业绩保证。


价格
1.12K
免费安装