
ADX and ADI
مؤشر
258 التنزيلات
الإصدار 1.0، Aug 2025
Windows, Mac
5.0
التقييمات: 2
الوصف
الميزات الرئيسية:
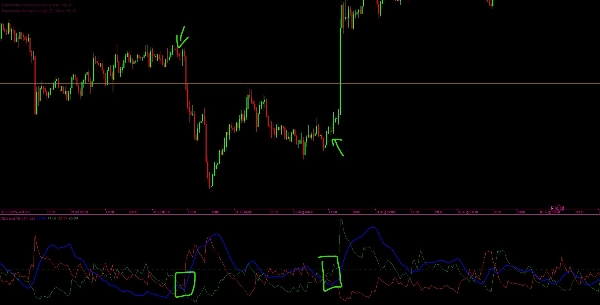
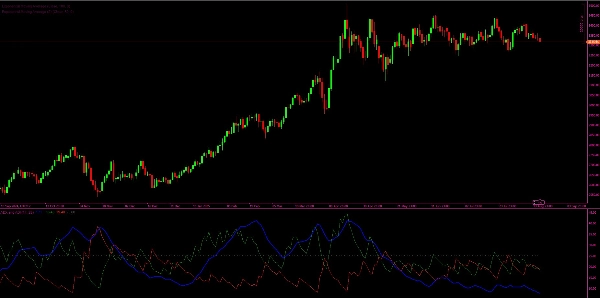
- خط ADX و ADI (أزرق): يعرض قوة الاتجاه الحالي الملساء، بغض النظر عن الاتجاه.
- خط +DI (أخضر): يشير إلى قوة الحركات الصاعدة.
- خط -DI (أحمر): يشير إلى قوة الحركات الهابطة.
- خط العتبة (رمادي): مستوى مرجعي أفقي (الافتراضي 25) للمساعدة في تحديد ما إذا كانت قوة الاتجاه مهمة.
كيف يعمل:
- يقوم المؤشر بحساب النطاق الحقيقي (TR)، الحركة الاتجاهية الإيجابية (+DM)، و الحركة الاتجاهية السلبية (-DM).
- يطبق تقنية التنعيم لويلدر لحساب القيم الملساء لـ TR و +DM و -DM.
- من هذه القيم، يتم اشتقاق المؤشرات الاتجاهية (+DI و -DI)، التي تظهر أي جانب (صعودي أو هبوطي) لديه زخم أقوى.
- يتم حساب مؤشر الاتجاه (DX) من الفرق النسبي بين +DI و -DI.
- أخيرًا، يتم حساب ADX (مؤشر الاتجاه المتوسط) كنسخة ملساء من DX، مما يوفر مقياسًا لقوة الاتجاه الكلي.
التفسير:
- عندما يكون ADX فوق العتبة (مثلاً، 25)، يُعتبر السوق في حالة اتجاه قوي.
- عندما يكون +DI > -DI، يكون الثيران في السيطرة (اتجاه صاعد).
- عندما يكون -DI > +DI، يكون الدببة في السيطرة (اتجاه هابط).
- عندما يكون ADX تحت العتبة، يُعتبر السوق في حالة تذبذب (اتجاه ضعيف أو لا يوجد اتجاه).
الملخص
ملخص الذكاء الاصطناعي
This custom indicator provides a full implementation of the Average Directional Index (ADX) and Directional Indicators (DI) to measure trend strength and direction in financial markets. It displays four key lines: the ADX and ADI line (blue) representing smoothed trend strength regardless of direction; the +DI line (green) indicating upward movement strength; the -DI line (red) indicating downward movement strength; and a threshold line (gray, default 25) to identify significant trend strength.
The indicator calculates True Range (TR), Positive Directional Movement (+DM), and Negative Directional Movement (-DM), applying Wilder’s smoothing technique to derive smoothed values. From these, it computes the +DI and -DI lines to show bullish or bearish momentum. The Directional Index (DX) is calculated from the relative difference between +DI and -DI, and the ADX is a smoothed version of DX, quantifying overall trend strength.
Interpretation guidelines include: ADX above the threshold signals a strong trend; +DI greater than -DI indicates bullish control; -DI greater than +DI indicates bearish control; and ADX below the threshold suggests a ranging or weak trend market.
ملف تعريف المؤشر
تقييمات العملاء
5.0
التقييمات: 2
5 | 100 % | |
4 | 0 % | |
3 | 0 % | |
2 | 0 % | |
1 | 0 % |
تقييمات العملاء
December 1, 2025
ADX and ADI delivers clean trend strength and direction signals. ADX shows when the market is actually trending, while +DI and -DI reveal who’s in control. Stable, lightweight and reliable across all timeframes. Best on H1+ for smoother signals. Alerts and zone-highlighting would be great additions.
September 12, 2025
مناقشة
الأسئلة الشائعة
يتم توفير المنتجات المتاحة من خلال cTrader Store، بما في ذلك روبوتات التداول والمؤشرات والإضافات، من قبل مطوري الطرف الثالث وإتاحتها لأغراض الوصول المعلوماتي والفني فقط. cTrader Store ليس وسيطًا ولا يقدم نصائح استثمارية أو توصيات شخصية أو أي ضمان للأداء المستقبلي.


![شعار "[Stellar Strategies] Market Session Ultimate"](https://cdn.ctrader.com/image/webp/61ffd537-0125-4246-9e72-42eca1791d64_28232)


السعر
منذ 21/02/2025
466.3M
حجم التداول
180.83K
الربح بالبيب
22
المبيعات
6.89K
التثبيتات المجانية