الوصف
Trend Scope Pro هو مؤشر تقني احترافي مصمم لمنح المتداولين فهماً أعمق لبنية السوق واتجاه السعر. مبني على خوارزميات الانحدار الخطي المتقدمة، يحسب هذا الأداة خط انحدار ديناميكي مع ثلاثة مستويات من قنوات الانحراف المعياري. من خلال الجمع بين الدقة الإحصائية والوضوح البصري، يساعدك على تحديد الاتجاهات السوقية الحالية، ومناطق الانعكاس المحتملة، ونطاقات التقلب بسهولة، مما يجعله إضافة قوية وسهلة الوصول لأي مجموعة أدوات تداول.
كيفية قراءة Trend Scope Pro
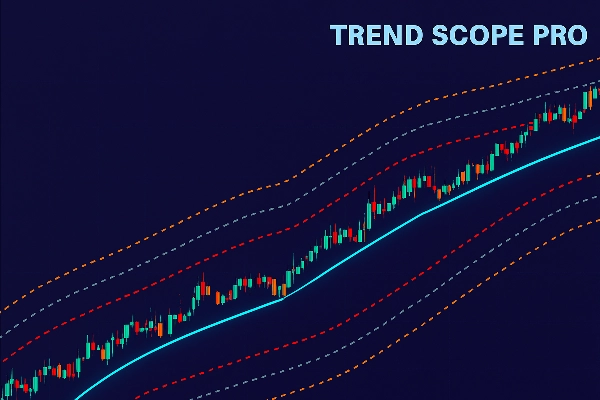
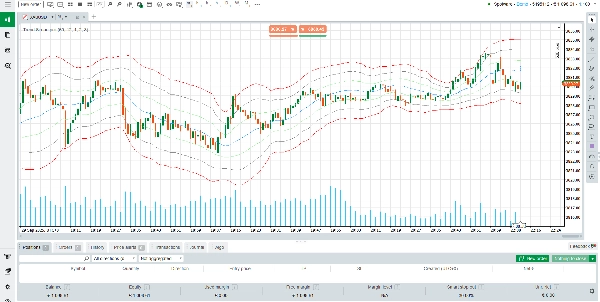
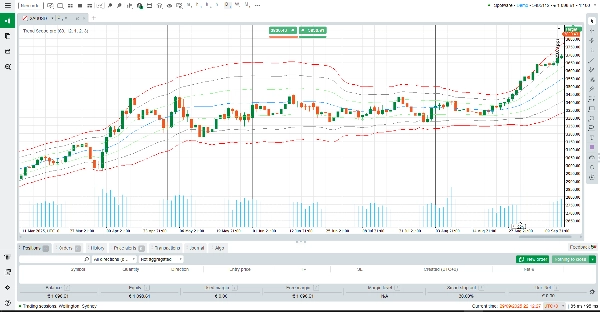
عند تطبيقه على الرسم البياني الخاص بك، يرسم Trend Scope Pro خط انحدار مركزي (أزرق)، والذي يمثل "القيمة العادلة" أو متوسط اتجاه الاتجاه خلال فترة محددة. حول هذا الخط، يتم رسم ثلاث مجموعات من القنوات العلوية والسفلية (برتقالي، رمادي، وأحمر). يتم حساب كل قناة باستخدام مضاعف انحراف معياري مختلف:
الأعلى/الأدنى 1 (برتقالي): يمثل الانحراف المعياري الأول. غالبًا ما تعكس تحركات السعر داخل هذه المنطقة تقلبات قصيرة الأجل طبيعية.
الأعلى/الأدنى 2 (رمادي): يشير إلى انحرافات أقوى. الوصول إلى هذه المنطقة غالبًا ما يشير إلى حركة ممتدة أو زخم متطور.
الأعلى/الأدنى 3 (أحمر): مناطق قصوى حيث قد يكون السوق في حالة شراء مفرط أو بيع مفرط، مما يخلق فرص انعكاس محتملة.
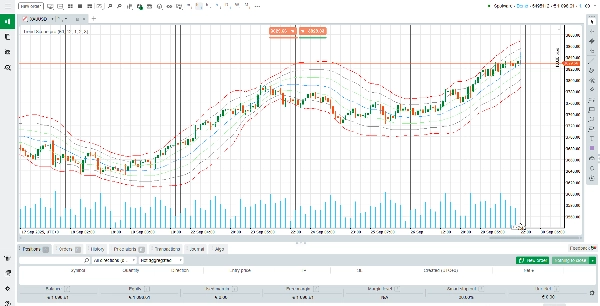
في الممارسة العملية، يمكن للمتداولين استخدام خط الانحدار لتأكيد اتجاه الاتجاه، بينما تعمل القنوات كمستويات دعم ومقاومة ديناميكية. على سبيل المثال:
إذا ظل السعر باستمرار فوق خط الانحدار، فإن الاتجاه صاعد.
إذا اختبر السعر مرارًا أو كسر تحت خط الانحدار، فإن الاتجاه يضعف.
اللمسات القصوى عند القنوات الحمراء قد تبرز نقاط الإرهاق، حيث تكون الانعكاسات أو التراجعات أكثر احتمالًا.
كيف يعمل المؤشر
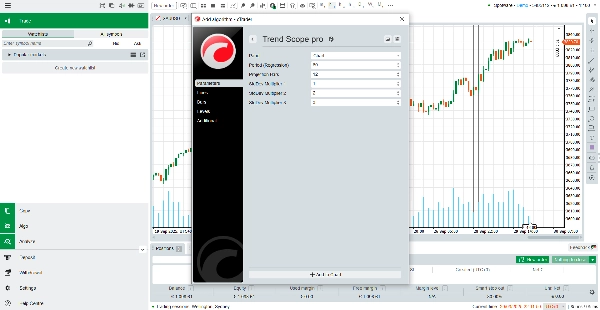
يحسب Trend Scope Pro خط الانحدار من خلال تحليل أسعار الإغلاق خلال فترة نظر مختارة. ثم يقيس الانحراف المعياري للسعر عن هذا الخط، مما يحدد عرض كل قناة. يضمن هذا النهج الإحصائي أن يتكيف المؤشر مع التقلبات في الوقت الحقيقي، موفرًا توازنًا بين إشارات متابعة الاتجاه ورؤى الانعكاس المتوسط.
الإعدادات الافتراضية (60 شريطًا للنظر للخلف، مضاعفات 1.0، 2.0، 3.0) محسنة لمعظم الأدوات، ولكن يمكنك تعديلها بسهولة لتناسب استراتيجيتك أو الإطار الزمني الخاص بك. سواء كنت متداول يوم يبحث عن دخول خلال اليوم، أو متداول تأرجح يحلل دورات السوق الأوسع، يوفر Trend Scope Pro سياقًا موثوقًا لاتخاذ القرار.
الميزات الرئيسية لـ Trend Scope Pro
الانحدار الخطي التكيفي – يحسب الاتجاه المركزي للسوق ديناميكيًا لتحيز اتجاهي دقيق.
قنوات متعددة المستويات – ثلاث مجموعات من نطاقات الانحراف تساعد في تحديد التحركات الطبيعية، الاتجاهات القوية، والظروف القصوى.
وضوح بصري – خطوط نظيفة وملونة تسهل تفسير حركة السعر بنظرة سريعة.
إعدادات قابلة للتخصيص – فترات نظر مرنة ومضاعفات انحراف لتناسب أي أسلوب تداول.
باختصار، يجمع Trend Scope Pro بين الموثوقية الإحصائية وقابلية الاستخدام العملية. إنه أكثر من مجرد خط اتجاه—إنه إطار عمل كامل لتحليل سلوك السعر، وتحديد المناطق ذات الاحتمالية العالية، وتحسين توقيت التداول. سواء كنت تبحث عن تأكيد الاتجاه، توقع الانعكاسات، أو ببساطة إضافة هيكل إلى رسومك البيانية، يقدم Trend Scope Pro الوضوح والثقة التي تحتاجها.
الملخص
تقييمات العملاء
5 | 50 % | |
4 | 50 % | |
3 | 0 % | |
2 | 0 % | |
1 | 0 % |


