
WAVETREND_withSourceCode
مؤشر
الإصدار 1.0، Oct 2025
Windows, Mac
5.0
التقييمات: 2
الوصف
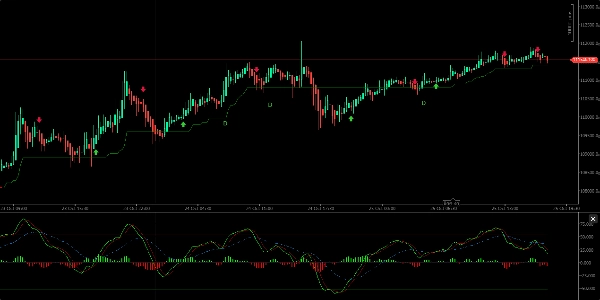
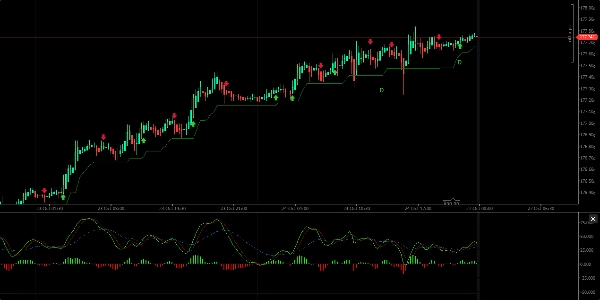
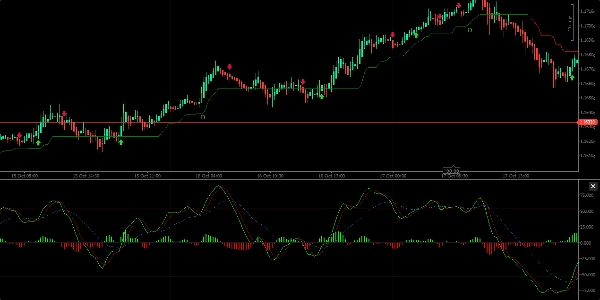
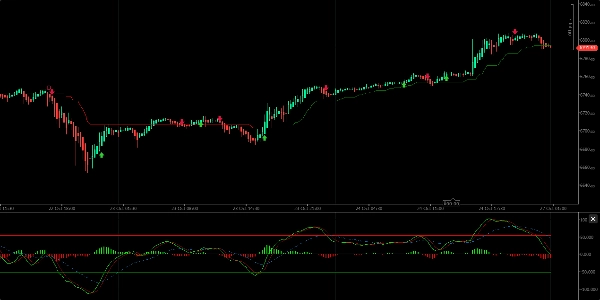
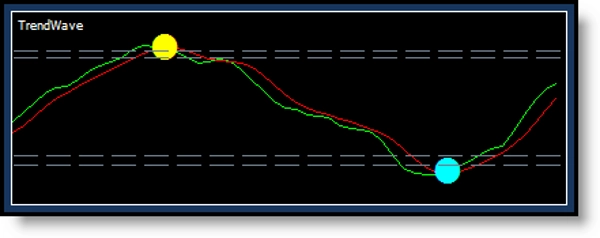
يوفر إشارات الشراء والبيع، ويشير إلى اتجاه الاتجاه، ويحدد مناطق الشراء المفرط والبيع المفرط. بصريًا، يتكون من خطين للقيمة مع سحابة/مخطط بياني في الوسط، يتحرك فوق وتحت خط منتصف، يمثل الاتجاهات الصاعدة أو الهابطة.
الميزات الرئيسية:
- تحدث إشارات الشراء عندما يعبر الخط الأخضر الخط الأحمر صعودًا؛ وإشارات البيع عندما يعبر الخط الأخضر للأسفل.
- يعرض اتجاه الاتجاه مع موجات السحابة فوق أو تحت خط المنتصف.
- يعرض المؤشر نقاطًا خضراء (شراء) وحمراء (بيع) عند نقاط التقاطع، مع تغييرات في لون الشمعة المقابلة (أصفر للشراء، فيروزي للبيع).
- يُفضل استخدامه على فترات 12 ساعة أو يوم واحد لتجنب الضوضاء القصيرة الأجل المفرطة.
- يمكن للمؤشر تحديد التباينات بين السعر والزخم (تباين صعودي وهبوطي منتظم)، مما يشير إلى احتمالية انعكاسات السعر.
- ينصح بدمج WaveTrend مع مؤشرات أخرى مثل WMA وCMF وRSI وMACD لاتخاذ قرارات تداول أكثر موثوقية.
بشكل عام، WaveTrend هو أداة وظيفية مفيدة لتحديد اتجاه الاتجاه وإشارات التداول، ولكن يجب استخدامها جنبًا إلى جنب مع أدوات تحليل أخرى للتأكيد.
الملخص
ملف تعريف المؤشر
تقييمات العملاء
5.0
التقييمات: 2
5 | 100 % | |
4 | 0 % | |
3 | 0 % | |
2 | 0 % | |
1 | 0 % |
تقييمات العملاء
November 6, 2025
the main upside is the trade idea gets slowed down first. The setup still needs say no.
مناقشة
الأسئلة الشائعة
Signal
ZigZag
EURUSD
Supertrend
GBPUSD
RSI
XAUUSD
NAS100
ATR
MACD
يتم توفير المنتجات المتاحة من خلال cTrader Store، بما في ذلك روبوتات التداول والمؤشرات والإضافات، من قبل مطوري الطرف الثالث وإتاحتها لأغراض الوصول المعلوماتي والفني فقط. cTrader Store ليس وسيطًا ولا يقدم نصائح استثمارية أو توصيات شخصية أو أي ضمان للأداء المستقبلي.


السعر
منذ 16/03/2025
256
التثبيتات المجانية