
Daily TPO profile
مؤشر
213 التنزيلات
الإصدار 1.0، Nov 2025
Windows, Mac
الوصف
الملف الشخصي اليومي لـ TPO
مؤشر الملف الشخصي اليومي لـ TPO الذي يحسب POC و VAH و VAL لكل جلسة.
يرسم نقطة التحكم ومنطقة القيمة 70٪ مباشرة على الرسم البياني، مما يساعدك على تحديد مناطق القيمة العادلة، ومستويات الدعم/المقاومة الرئيسية، والمناطق المحتملة لرفض السعر أو قبوله.
كيف يعمل
يبني هذا المؤشر ملف TPO اليومي (فرصة السعر والوقت)، مشابه لملف السوق.
لكل شريط من يوم التداول، فإنه:
- يقسم محور السعر إلى "خطوات" ثابتة محددة بواسطة "حجم الصف (نقاط)"
- لكل خطوة سعر، يحسب عدد الأشرطة التي لمست ذلك المستوى (TPO = عدد المرات التي تم التداول فيها عند السعر)
- في نهاية اليوم يحسب:
-
- POC (نقطة التحكم) → مستوى السعر الذي يحتوي على أعلى عدد من TPOs (حيث قضى السوق معظم الوقت)
- VAH (منطقة القيمة العليا) و VAL (منطقة القيمة الدنيا) → مستويات السعر التي تحتوي تقريبًا على نسبة منطقة القيمة (الافتراضية 70٪) من جميع TPOs لتلك الجلسة
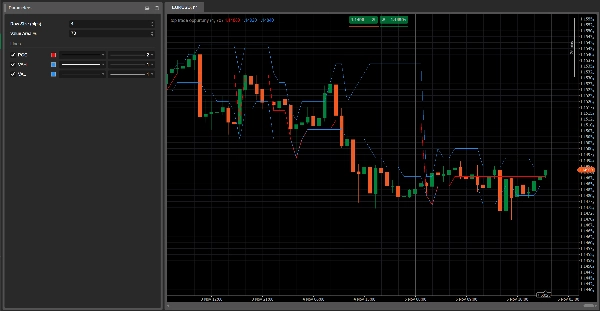
يرسم المؤشر ثلاث خطوط أفقية على الرسم البياني:
- الخط الأحمر → POC
- الخطوط الزرقاء → VAH (الأعلى) و VAL (الأدنى)
يتم تحديث هذه الخطوط شريطًا بشريط خلال الجلسة ويتم إعادة تعيينها عند بدء يوم تداول جديد.
المعلمات الرئيسية
حجم الصف (نقاط)
يحدد سمك كل خطوة سعر في الملف الشخصي.-
- القيم الأصغر = ملف أكثر تفصيلاً
- القيم الأكبر = ملف أكثر سلاسة
نسبة منطقة القيمة
نسبة إجمالي TPOs المحتواة داخل منطقة القيمة (عادة 70٪).
منطقة القيمة هي منطقة السعر حيث حدث معظم نشاط السوق خلال اليوم.
كيفية قراءته
- POC (الخط الأحمر)
-
- مستوى السعر الأكثر "قبولًا" من السوق خلال ذلك اليوم.
- غالبًا ما يعمل كـ مستوى توازن: قد يرتد السعر، يتوقف أو يكسر بقوة حول هذه المنطقة.
- منطقة القيمة (VAH–VAL، الخطوط الزرقاء)
-
- تمثل منطقة "القيمة العادلة" حيث حدث معظم التداول.
- يمكن أن يظهر حركة السعر بالنسبة لـ VAH/VAL:
-
- رفض الأسعار القصوى (اختراقات زائفة تتجاوز VAH/VAL)
- قبول الأسعار الجديدة (توحيد خارج منطقة القيمة)
أفكار الاستخدام النموذجية
- السعر يرفض VAL ويعود داخل منطقة القيمة → فكرة شراء محتملة، مراهنة على العودة إلى "القيمة العادلة" (الارتداد المتوسط).
- السعر يكسر فوق VAH بقوة ويبدأ في بناء هيكل فوقه → بداية محتملة لـ منطقة قيمة أعلى جديدة (سيناريو متابعة الاتجاه).
- عدة أيام مع POCs حول نفس المستوى → منطقة توازن/تراكم قوية، غالبًا دعم/مقاومة رئيسية.
الملخص
ملخص الذكاء الاصطناعي
The Daily TPO Profile indicator constructs a daily Time Price Opportunity (TPO) profile similar to a Market Profile, analyzing market activity by price levels throughout each trading session. It divides the price axis into fixed increments ("Row Size" in pips) and counts how many bars traded at each price step, representing TPOs. At the end of the session, it calculates three key levels: the Point of Control (POC), where the market spent the most time; the Value Area High (VAH); and the Value Area Low (VAL), which together define the price range containing approximately 70% of the trading activity.
The indicator plots these levels as horizontal lines on the chart—POC in red, VAH and VAL in blue—updating them bar by bar during the session and resetting daily. Traders use the POC as an equilibrium price level that may act as support or resistance. The Value Area highlights fair value zones, with price action near VAH and VAL signaling potential rejection or acceptance of price extremes. Typical applications include identifying mean reversion opportunities when price rejects VAL or trend-following setups when price breaks above VAH.
Main adjustable parameters include Row Size (pips), controlling profile detail, and Value Area %, defining the percentage of TPOs included in the value area. The indicator supports analysis across various markets including forex, indices, commodities, stocks, and cryptocurrencies.
ملف تعريف المؤشر
تقييمات العملاء
0.0
التقييمات: 0
تقييمات العملاء
لا توجد تقييمات لهذا المنتج حتى الآن. هل جرَّبته بالفعل؟ كن أول من يخبر الآخرين!
مناقشة
الأسئلة الشائعة
Signal
Indices
Commodities
GBPUSD
RSI
Bollinger
Fibonacci
Scalping
AI
XAUUSD
NAS100
MACD
BTCUSD
Forex
Breakout
EURUSD
NZDUSD
Martingale
Prop
ZigZag
Supertrend
Fair Value Gap
SMC
Crypto
Grid
Stocks
ATR
USDJPY
VWAP
يتم توفير المنتجات المتاحة من خلال cTrader Store، بما في ذلك روبوتات التداول والمؤشرات والإضافات، من قبل مطوري الطرف الثالث وإتاحتها لأغراض الوصول المعلوماتي والفني فقط. cTrader Store ليس وسيطًا ولا يقدم نصائح استثمارية أو توصيات شخصية أو أي ضمان للأداء المستقبلي.


السعر
42.11M
حجم التداول
6.13M
الربح بالبيب
224
المبيعات
8.41K
التثبيتات المجانية