📈 مؤشر تحيز تقلب الانحراف – النسخة الاحترافية (لـ cTrader)
افتح فهماً أعمق لضغط السوق، اختلال التوازن في التقلبات، والقناعة الاتجاهية مع مؤشر تحيز تقلب الانحراف، النسخة المحسنة من نهج تقلب كلاسيكي مستوحى أصلاً من Pine Script ومُحسّن بالكامل الآن لـ cTrader.
يساعد هذا الأداة المتداولين على تصور أي جانب من السوق يضرب بقوة أكبر — المشترين أم البائعين — من خلال قياس عدم تماثل التقلبات وتحويله إلى إشارة واضحة وسهلة القراءة.
سواء كنت تتداول المؤشرات، الفوركس، السلع أو العملات المشفرة، فإن هذا المؤشر يعمل كـ مرشح اتجاه، كاشف نظام، وأداة تأكيد تحيز قوية.
1. ما الذي يقيسه مؤشر الانحراف
يقيم المؤشر توازن التقلبات بين الشموع الصاعدة والهابطة.
يحسب نطاقًا حقيقيًا مُطَبَّعًا ويُدخله في متوسطين تكيفيين:
- أقصى انحراف → التقلبات الناتجة خلال الشموع الصاعدة
- أدنى انحراف → التقلبات الناتجة خلال الشموع الهابطة
ثم يحسب:
👉 الانحراف = أقصى انحراف / أدنى انحراف
هذا يحول التقلبات الخام إلى قراءة اتجاهية واضحة:
- الانحراف > 1 → تحركات الصعود أقوى في المتوسط
- الانحراف < 1 → تحركات الهبوط أقوى
- الانحراف ≈ 1 → التقلبات متناظرة والسوق متوازن
باختصار:
الانحراف يكشف أي جانب له "هيمنة التقلبات".
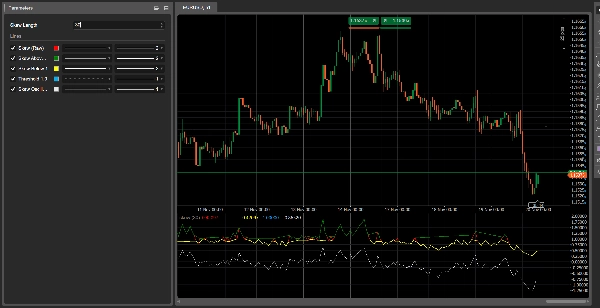
2. فهم الخطوط
1. الانحراف (خام) – الخط الأحمر
نسبة التقلبات الصافية. هذه هي الإشارة الأساسية.
2. الانحراف فوق 1 – الخط الأخضر
يُظهر هيمنة تقلبات صاعدة.
3. الانحراف تحت 1 – الخط الأصفر
يُظهر هيمنة تقلبات هابطة.
4. خط العتبة 1.0 – الخط الأزرق المنقط
يمثل التوازن.
5. مذبذب الانحراف (لوغاريتمي) – الخط الأبيض
تمثيل أكثر استقرارًا ونعومة:
- أعلى من 0 = تقلبات صاعدة
- أدنى من 0 = تقلبات هابطة
3. كيفية قراءته
أ) أنظمة السوق
🔹 نظام صاعد
- الانحراف > 1
- الخط الأخضر نشط
- المذبذب فوق الصفر
→ السوق يفضل الشراء.
🔹 نظام هابط
- الانحراف < 1
- الخط الأصفر نشط
- المذبذب تحت الصفر
→ السوق يفضل البيع.
🔹 محايد
- الانحراف ≈ 1
→ السوق متوازن، مناسب لتداول النطاق.
4. إشارات تغير النظام
عبور الانحراف فوق 1
→ المشترون يكتسبون هيمنة التقلبات
→ انتقال صاعد
عبور الانحراف تحت 1
→ البائعون يكتسبون هيمنة التقلبات
→ انتقال هابط
غالبًا ما تحدث هذه التحولات قبل تأكيد حركة السعر للاتجاه، مما يجعل الانحراف مؤشرًا مبكرًا قويًا.
5. حالات الاستخدام العملية
1️⃣ مرشح الاتجاه لـ cBots
- التداول شراء فقط عندما يكون SkewOsc > 0
- التداول بيع فقط عندما يكون SkewOsc < 0
2️⃣ تأكيد جودة الاتجاه
- اتجاه صاعد + الانحراف > 1 = اتجاه قوي
- اتجاه صاعد + الانحراف يتجه نحو 1 = اتجاه يضعف
3️⃣ مزاج السوق / مرشح المخاطر
فعال بشكل خاص على المؤشرات وأزواج الفوركس الرئيسية.
6. ملخص
- ما يظهره: هيمنة التقلبات
- لماذا هو مهم: تحولات التقلبات تسبق تحولات السعر
- كيفية استخدامه: كمرشح، أداة تأكيد، أو مقياس مزاج
- أفضل جزء: خفيف جدًا، سريع، وقابل للتكيف
5 | 67 % | |
4 | 33 % | |
3 | 0 % | |
2 | 0 % | |
1 | 0 % |


