الوصف
وصف قصير
خريطة نظام الاتجاه والحجم هي فلتر نظام لـ cTrader يقيس اتجاه واستمرارية كل من السعر والحجم. يمنحك درجة اتجاه معيارية ودرجة اتجاه حجم ضمن النطاق –10 إلى +10، يلون شموعك بتدرج سلس من الأحمر الهبوطي إلى الأخضر الصعودي، ويُظهر ما إذا كانت البيئة الحالية محفوفة بالمخاطر، خالية من المخاطر، أو مجرد ضوضاء.
🧠 ما الذي يفعله
يقوم هذا المؤشر بتكرار منطق "مرشح النظام" لـ BigBeluga من TradingView، مُكيفًا لـ cTrader ومغلفًا في خريطة نظام الاتجاه والحجم واضحة.
السعر والحجم المملسان
- يحسب HLC3 (متوسط الأعلى، الأدنى، الإغلاق) ويطبق المتوسط المتحرك لهول (HMA) لتنعيم السعر.
- يطبق متوسطًا متحركًا آخر لهول HMA على حجم التيك.
درجة الاتجاه (السعر)
- لآخر N أشرطة (
الطول)، يقارن HMA الحالي للسعر مع كل قيمة HMA سابقة:
- إذا كان HMA الحالي > HMA السابق → الاتجاه +1
- إذا كان HMA الحالي ≤ HMA السابق → الاتجاه –1
- يتم تحويل الدرجة المتراكمة إلى مقياس –10 … +10 → وهذه هي قيمة الاتجاه.
درجة اتجاه الحجم
- يستخدم نفس المنطق، لكنه يُطبق على HMA للحجم.
- النتيجة هي درجة معيارية أخرى ضمن –10 … +10 → وهي قيمة الحجم.
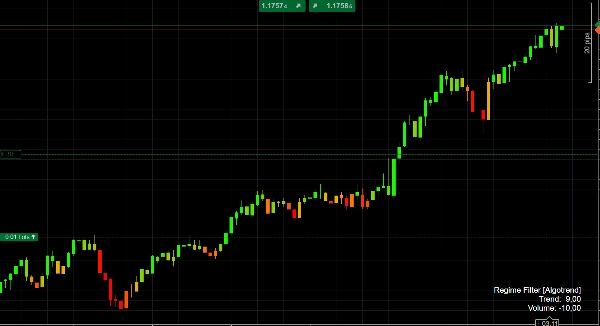
منطق اللون
- عندما تكون درجة الاتجاه سالبة، تُلون الشموع بتدرج من الأحمر → البرتقالي حسب قوة النظام الهبوطي.
- عندما تكون درجة الاتجاه موجبة، تُلون الشموع من البرتقالي → الليموني، مع خضرة أقوى للنظم الصعودية الأقوى.
هذا يمنحك إشارة بصرية فورية لما إذا كان تحرك السعر هبوطيًا، محايدًا، أو صعوديًا، ومدى استمرارية هذا النظام حاليًا.
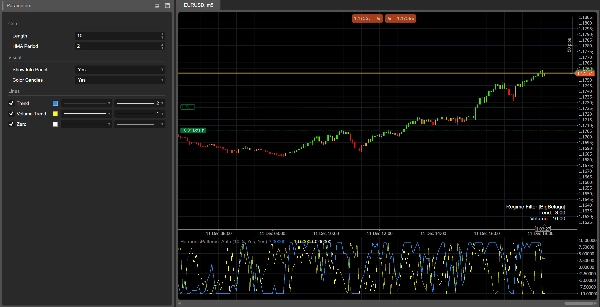
لوحة النظام
في النافذة الفرعية، يرسم المؤشر:
- خط الاتجاه (أزرق)
- خط اتجاه الحجم (رمادي)
- خط الصفر (الخط الأساسي)
على الشمعة الأخيرة يطبع لوحة معلومات صغيرة مع القيم الحالية لـ الاتجاه و الحجم.
🎯 كيف يمكنك استخدامه
تأكيد الاتجاه
- تداول فقط في اتجاه نظام قوي، على سبيل المثال:
- الاتجاه > +4 → تحيز للشراء فقط
- الاتجاه < –4 → تحيز للبيع فقط
فلتر النظام
- قم بإيقاف تشغيل أو تقليل استراتيجيتك عندما يكون النظام ضعيفًا (الاتجاه قريب من 0) أو عندما يكون اتجاه الحجم سلبيًا بشدة، مما يشير غالبًا إلى تحركات متقطعة أو متلاشية.
السياق للإشارات
ادمج إشارات الدخول الحالية لديك (حركة السعر، الأنماط التناغمية، المؤشرات المتذبذبة، إلخ) مع خريطة نظام الاتجاه والحجم كـ فلتر كلي:
- خذ فقط الاختراقات عندما يكون الاتجاه إيجابيًا واتجاه الحجم أيضًا إيجابيًا.
- تجنب إعدادات الارتداد إلى المتوسط عندما يكون الاتجاه قويًا جدًا (> +8 أو < –8)، حيث يكون السوق في نظام اتجاهي قوي.
⚙️ معلمات الإدخال
الأساس
الطول
عدد الأشرطة المستخدمة لبناء درجات الاتجاه والحجم.
- القيم الأعلى → نظام أكثر سلاسة و"كلي"؛ أبطأ في التغيير لكنه أكثر استقرارًا.
- القيم الأقل → استجابة أسرع، لكن مع المزيد من الضوضاء والتقلبات المتكررة.
فترة HMA
فترة المتوسط المتحرك لهول المستخدمة لتنعيم كل من السعر والحجم.
- قم بضبطها لتتناسب مع الإطار الزمني وأسلوب التداول الخاص بك: أقصر للأطر الزمنية المنخفضة، وأطول للأطر الزمنية الأعلى.
مرئي
عرض لوحة المعلومات
يعرض/يخفي لوحة النص الصغيرة على الشمعة الأخيرة مع درجات الاتجاه و الحجم الحالية.تلوين الشموع
يُمكّن تلوين الشموع بناءً على قيمة الاتجاه (تدرج أحمر / برتقالي / أخضر). قم بإيقاف تشغيله إذا كنت تفضل الاحتفاظ بألوان المخطط الافتراضية.
✅ ورقة غش التفسير
- الاتجاه ≥ +7 → نظام صعودي قوي، الشموع خضراء زاهية.
- الاتجاه بين +3 و +7 → تحيز صعودي؛ التراجعات هي مناطق محتملة للشراء عند الهبوط.
- الاتجاه بين –3 و +3 → جانبي / متقطع؛ الإشارات أقل موثوقية.
- الاتجاه ≤ –7 → نظام هبوطي قوي، الشموع حمراء داكنة.
- اتجاه الحجم > 0 → نشاط متزايد / مستمر، التحركات أكثر احتمالًا أن تكون "حقيقية" ومستدامة.
- اتجاه الحجم < 0 → تراجع المشاركة، خطر أعلى من التحركات المزيفة، التقطع، أو الانعكاسات.
الملخص
تقييمات العملاء
5 | 0 % | |
4 | 100 % | |
3 | 0 % | |
2 | 0 % | |
1 | 0 % |


![شعار "[Hamster-Coder] Pivot Points MTF"](https://cdn.ctrader.com/image/webp/4c143e5a-309c-40e3-a578-f04d1e133ffa_31159)


![شعار "High-Low Divergence [Iridio Capital]"](https://cdn.ctrader.com/image/webp/443c4661-7abb-40f1-842f-4b6ec560649b_40914)


