

Açıklama
FİKİR
Her kırılmayı izole olarak görmek yerine daha yüksek zaman dilimi aralığı bağlamı ekleyen bir Donchian Kanalı.
SORUN
Standart bir Donchian Kanalı, fiyatın yakın zamanda bir ekstrem değere ulaştığını söyler.
Ancak bir kırılma izole olarak gerçekleşmez.
M15'teki bir kırılma önemli olabilir — ya da sadece fiyatın çok daha büyük bir Günlük veya Haftalık aralık içinde hareket etmesi olabilir.
Aynı kırılma, daha yüksek zaman dilimi aralığında nerede gerçekleştiğine bağlı olarak çok farklı bağlamlara sahip olabilir.
Kanal kırılmayı gösterir. Ancak kanal tek başına bu kırılmanın daha büyük aralık içindeki yerini göstermez.
TEMEL KONSEPT: KANAL HAREKETİ GÖSTERİR. DAHA YÜKSEK ZAMAN DİLİMİ NEREDE OLDUĞUNU GÖSTERİR.
Bir kırılma sadece bir olay değildir.
Ayrıca bir konumu vardır.
İki kırılma, uygulama zaman diliminde aynı görünebilir ancak daha yüksek zaman dilimi aralığında çok farklı pozisyonlarda gerçekleşebilir.
Biri daha büyük aralığın ortasına yakın olabilir.
Diğeri doğrudan üst sınırının içinde olabilir.
Fiyat hareketi aynı görünebilir.
Bağlam ise aynı değildir.
Bu gösterge, önceki tamamlanmış daha yüksek zaman dilimi aralığını mevcut grafiğinize doğrudan yerleştirerek bu bağlamı görünür kılar.
Sadece şunu sormak yerine:
"Fiyat kanalını kırdı mı?"
aynı zamanda şunu da sorabilirsiniz:
"Kırılma nerede gerçekleşti?"
NE YAPAR
Zaman Dilimi Bağlamlı Donchian Kanalı, tek bir grafikte iki bilgi katmanını birleştirir:
1. Mevcut Zaman Dilimi Donchian
Standart Donchian Kanalı, mevcut piyasanın yakın zamandaki yüksek, düşük ve orta noktasını takip eder.
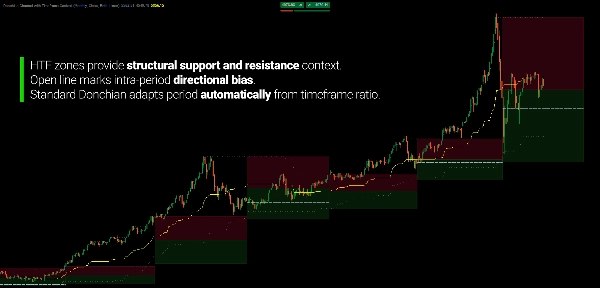
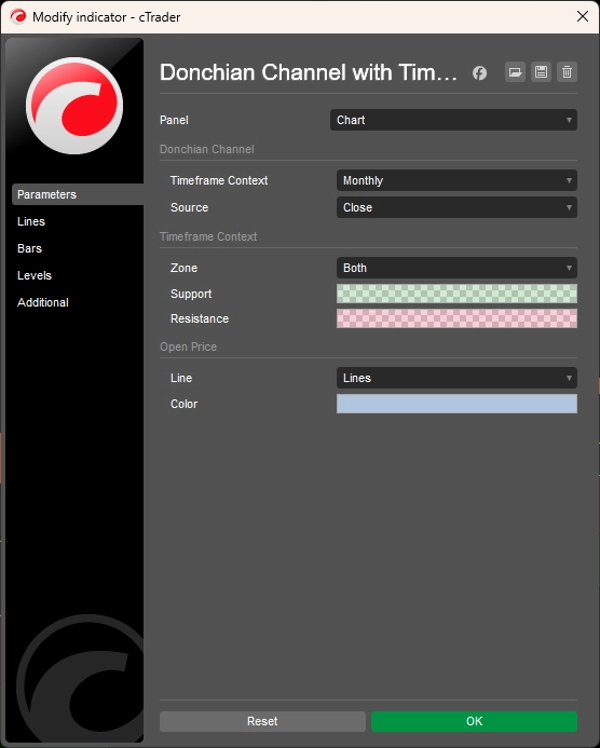
Periyodu, grafik zaman diliminiz ile seçilen bağlam zaman dilimi arasındaki orandan otomatik olarak hesaplanır. Örneğin, H1 grafikte Haftalık bağlam 120 bar geriye dönük bir görünüm üretir.
Kanalın 20, 50 veya 100 bar kullanıp kullanmayacağına karar vermenize gerek yoktur.
Zaman dilimi ilişkisi geriye dönük görünümü tanımlar.
2. Daha Yüksek Zaman Dilimi Bağlamı
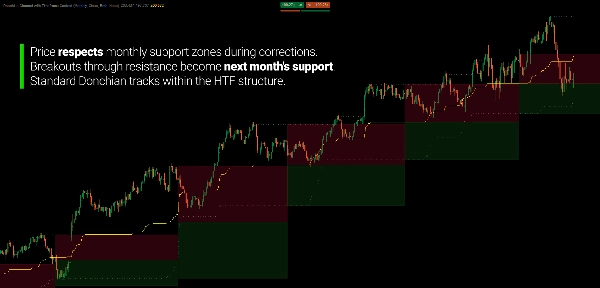
Önceki tamamlanmış daha yüksek zaman dilimi periyodunun aralığı, destek ve direnç bölgeleri olarak mevcut grafiğinize yansıtılır.
Aralığı iki bölgeye ayrılır:
Destek Bölgesi
Önceki periyodun düşük seviyesinden orta noktasına kadar.
Direnç Bölgesi
Orta noktadan önceki periyodun yüksek seviyesine kadar.
Fiyat mevcut zaman diliminizde gelişirken, bu daha büyük aralık içindeki konumunu hemen görebilirsiniz.
İKİ ZAMAN DİLİMİ. TEK GRAFİK.
Mevcut zaman dilimi Donchian, yakın zamandaki ekstremler etrafında gelişen hareketi gösterir.
Daha yüksek zaman dilimi aralığı daha büyük referans çerçevesini sağlar.
Örneğin:
Haftalık bağlam → H1 grafik
veya
Günlük bağlam → M5 grafik
Alt zaman dilimi aktif hareket olarak kalır.
Üst zaman dilimi sadece çevreleyen aralığı sağlar.
Kanal fiyatın ne yaptığını gösterir. Daha yüksek zaman dilimi nerede olduğunu gösterir.
DAHA YÜKSEK ZAMAN DİLİMİ ALT OLANI GEÇERSİZ KILMAZ
Daha yüksek zaman dilimi aralığı, fiyatın ne yapması gerektiğini söyleyen bir sinyal değildir.
Bir referans çerçevesidir.
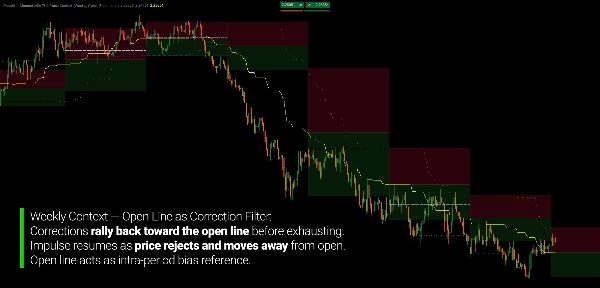
Daha düşük zaman dilimi kırılması, daha yüksek zaman dilimi direncini aşabilir.
Bir geri çekilme, daha yüksek zaman dilimi desteği içinde durabilir.
Fiyat ayrıca önceki aralığın tamamen ötesine geçip yeni bir bölgeye girebilir.
Amaç hangi sonucun gerçekleşeceğini tahmin etmek değildir.
Amaç, daha küçük hareket gelişirken daha büyük aralığı görünür kılmaktır.
BAĞLAMIN KENDİSİNİ GÜNCELLEMESİNE İZİN VERİN
Daha yüksek zaman dilimi bölgeleri, önceki tamamlanmış periyoda dayanır.
Yeni bir daha yüksek zaman dilimi periyodu başladığında, bağlam aralığı güncellenir.
Örneğin:
Önceki Hafta → Mevcut Hafta
Önceki haftanın yüksek, düşük ve orta noktası mevcut hafta için referans olur.
H1 grafikte, bu sınırlar mevcut periyot Donchian Kanalı gelişirken görünür kalır.
Böylece önceki periyot aralığını manuel olarak çizmeden kalıcı bir referans elde edersiniz.
ZAMAN DİLİMİ BAĞLAMI SİZİN SEÇİMİNİZDİR
İstediğiniz bağlamı sağlayan daha yüksek zaman dilimini seçin:
- Aylık
- Haftalık
- Günlük
- 4 Saat
- 1 Saat
- 30 Dakika
- 15 Dakika
- Ve diğer desteklenen kombinasyonlar
Gösterge ilgili Donchian periyodunu otomatik olarak yönetir.
Bağlamı siz seçersiniz. Hesaplama buna uyum sağlar.
İSTEĞE BAĞLI AÇILIŞ FİYATI REFERANSI
Mevcut daha yüksek zaman dilimi periyodunun açılış fiyatı da gösterilebilir.
Bu, fiyatın mevcut daha yüksek zaman dilimi periyodunun açılış fiyatına göre nerede işlem gördüğüne dair başka bir referans sağlar.
Ek bağlam istediğinizde bunu etkinleştirin.
Grafiğin sadece iki Donchian katmanına odaklanmasını istediğinizde gizleyin.
KANALIN NASIL HESAPLANDIĞINI SEÇİN
Donchian sınırları şunlardan hesaplanabilir:
Kapanış
veya
Yüksek / Düşük
Kapanış bazlı hesaplama, sınırları kapanış fiyatlarından üretir.
Yüksek/Düşük hesaplama, tam fitil uçlarını içerir ve bu nedenle daha geniş bir fiyat aralığını temsil eder.
Aynı kaynak seçimi, hem mevcut zaman dilimi hem de daha yüksek zaman dilimi hesaplamalarına tutarlı şekilde uygulanır.
BAĞLAM İÇİN TASARLANDI, SİNYAL PEŞİNDE KOŞMAK İÇİN DEĞİL
Zaman Dilimi Bağlamlı Donchian Kanalı bir kırılma tahmin sistemi değildir.
Bir kırılmanın başarılı olup olmayacağını size söylemez.
Onu gözlemlemek için tanımlı bir ortam sağlar.
Şunu incelemek için kullanın:
- Kırılmalar
- Geri çekilmeler
- Daha yüksek zaman dilimi sınırları
- Daha büyük bir aralık içindeki pozisyon
- Önceki ekstremlerin ötesine genişleme
- Çok zaman dilimli fiyat geometrisi
- Mevcut hareketin önceki periyoda göre durumu
Standart Donchian size mevcut ekstremlerin nerede olduğunu söyler.
Daha yüksek zaman dilimi bağlamı, bu ekstremlerin daha büyük aralık içinde nerede olduğunu söyler.
ANA ÖZELLİKLER
- Standart Donchian Kanalı
- Otomatik mevcut zaman dilimi periyot hesaplaması
- Daha yüksek zaman dilimi aralık projeksiyonu
- Destek ve direnç bağlam bölgeleri
- Önceki periyot yüksek, düşük ve orta noktası
- Aylıktan 15 Dakikaya kadar 13 seçilebilir zaman dilimi bağlamı
- İsteğe bağlı daha yüksek zaman dilimi açılış fiyatı
- Kapanış veya Yüksek/Düşük hesaplama modları
- Bölge gösterimi yapılandırılabilir: Her ikisi, sadece Destek, sadece Direnç veya Hiçbiri
- Sadece Destek / Sadece Direnç gösterim seçenekleri
- Gerçek zamanlı güncellemeler
- Zaman bazlı ve zamana bağlı olmayan grafikler için destek, Tick, Renko ve Aralık dahil
---
Ticaret risk içerir. Bu gösterge teknik analiz aracıdır ve uygun risk yönetimi ile birlikte kullanılmalıdır.
Özet
This dual-layer system automatically adapts the Donchian lookback period based on the ratio between the selected higher timeframe and the chart timeframe, eliminating manual period settings. It supports 13 timeframe options from Monthly to 15 Minutes and can be applied across various markets including forex pairs (EURUSD, GBPUSD, USDJPY, NZDUSD), commodities (XAUUSD), indices (NAS100), and cryptocurrencies (BTCUSD).
Key features include real-time updates of both standard and higher-timeframe channels, configurable visual zones with adjustable colors and transparency, an optional open price line marking the higher-timeframe period’s open, and flexible price source settings (close or high/low).
The indicator aids traders in filtering false breakouts by showing whether price movements occur within structural supply or demand zones on a higher timeframe. It is designed for trend-following, swing, and discretionary traders who use Donchian channels and seek enhanced structural context to better assess breakout significance and correction exhaustion without switching timeframes.
Müşteri değerlendirmeleri
Tartışma
SSS
























Fiyat